BMW 2014 Annual Report Download - page 95
Download and view the complete annual report
Please find page 95 of the 2014 BMW annual report below. You can navigate through the pages in the report by either clicking on the pages listed below, or by using the keyword search tool below to find specific information within the annual report.-
 1
1 -
2
-
3
-
4
-
5
-
6
-
7
-
8
-
9
-
10
-
11
-
12
-
13
-
14
-
15
-
16
-
17
-
18
-
19
-
20
-
21
-
22
-
23
-
24
-
25
-
26
-
27
-
28
-
29
-
30
-
31
-
32
-
33
-
34
-
35
-
36
-
37
-
38
-
39
-
40
-
41
-
42
-
43
-
44
-
45
-
46
-
47
-
48
-
49
-
50
-
51
-
52
-
53
-
54
-
55
-
56
-
57
-
58
-
59
-
60
-
61
-
62
-
63
-
64
-
65
-
66
-
67
-
68
-
69
-
70
-
71
-
72
-
73
-
74
-
75
-
76
-
77
-
78
-
79
-
80
-
81
-
82
-
83
-
84
-
 85
85 -
 86
86 -
 87
87 -
 88
88 -
 89
89 -
 90
90 -
 91
91 -
 92
92 -
 93
93 -
 94
94 -
 95
95 -
 96
96 -
 97
97 -
 98
98 -
 99
99 -
 100
100 -
 101
101 -
 102
102 -
 103
103 -
 104
104 -
 105
105 -
106
-
107
-
108
-
109
-
110
-
111
-
112
-
113
-
114
-
115
-
116
-
117
-
118
-
119
-
120
-
121
-
122
-
123
-
124
-
125
-
126
-
127
-
128
-
129
-
130
-
131
-
132
-
133
-
134
-
135
-
136
-
137
-
138
-
139
-
140
-
141
-
142
-
143
-
144
-
145
-
146
-
147
-
148
-
149
-
150
-
151
-
152
-
153
-
154
-
155
-
156
-
157
-
158
-
159
-
160
-
161
-
162
-
163
-
164
-
165
-
166
-
167
-
168
-
169
-
170
-
171
-
172
-
173
-
174
-
175
-
176
-
177
-
178
-
179
-
180
-
181
-
182
-
183
-
184
-
185
-
186
-
187
-
188
-
189
-
190
-
191
-
192
-
193
-
194
-
195
-
196
-
197
-
198
-
199
-
200
-
201
-
202
-
203
-
204
-
205
-
206
-
207
-
208
-
209
-
210
-
211
-
212
 |
 |

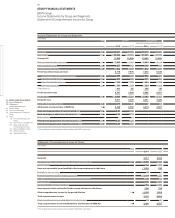
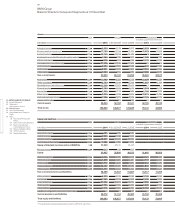
95 GROUP FINANCIAL STATEMENTS
Automotive Financial Services
(unaudited supplementary information) (unaudited supplementary information)
2014 2013
1
2014 2013
1
4,521 4,408 1,198 1,101 Net profit
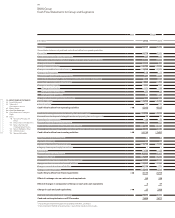
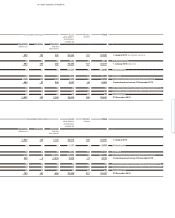
Reconciliation between net profit and cash inflow / outflow from operating activities
2,786 2,516 – 40 9 Current tax
159 154 242 17 2 Other interest and similar income / expenses
4,230 3,747 29 20 Depreciation and amortisation of other tangible, intangible and investment assets
1,034 374 109 153 Change in provisions
15 109 – 3,309 – 2,895 Change in leased products
– – – 3,898 – 4,501 Change in receivables from sales financing
– 124 – 239 383 523 Change in deferred taxes
– 5 – 56 14 54 Other non-cash income and expense items
– 54 – 21 8 – Gain / loss on disposal of tangible and intangible assets and marketable securities
– 655 – 407 – – Result from equity accounted investments
– 552 1,018 70 24 Changes in working capital
– 907 – 229 – 4 Change in inventories
371 53 14 – 25 Change in trade receivables
– 16 1,194 56 45 Change in trade payables
419 657 858 269 Change in other operating assets and liabilities
– 2,531 – 2,487 – 161 – 132 Income taxes paid
180 191 –2 –2 Interest received
9,423 9,964 – 4,715 – 5,358 Cash inflow / outflow from operating activities
– 6,021 – 6,599 – 9 – 9 Investment in intangible assets and property, plant and equipment
36 15 – 7 Proceeds from the disposal of intangible assets and property, plant and equipment
– 134 – 514 – – Expenditure for investments
177 137 – 163 Proceeds from the disposal of investments
– 3,775 – 3,945 – 458 – 179 Investments in marketable securities and term deposits
3,881 2,908 170 342 Proceeds from the sale of marketable securities and from matured term deposits
– 5,836 – 7,998 – 297 324 Cash inflow / outflow from investing activities
– – – – Issue / buy-back of treasury shares
15 17 – – Payments into equity
– 1,715 – 1,653 – – Payment of dividend for the previous year
– 4,299 – 582 4,094 3,844 Intragroup financing and equity transactions
– 136 – 150 –2 –2 Interest paid
– – 1,009 1,099 Proceeds from the issue of bonds
– – – 733 – 1,383 Repayment of bonds
452 85 5,298 6,015 Proceeds from new non-current other financial liabilities
– 41 – 26 – 4,814 – 4,940 Repayment of non-current other financial liabilities
1,042 125 1,073 517 Change in current other financial liabilities
– – 489 – – Change in commercial paper
– 4,682 – 2,673 5,927 5,152 Cash inflow / outflow from financing activities
70 – 53 – 11 – 36 Effect of exchange rate on cash and cash equivalents
2 47 – – Effect of changes in composition of Group on cash and cash equivalents
– 1,023 – 713 904 82 Change in cash and cash equivalents
6,775 7,488 879 797 Cash and cash equivalents as at 1 January
5,752 6,775 1,783 879 Cash and cash equivalents as at 31 December