BMW 2014 Annual Report Download - page 104
Download and view the complete annual report
Please find page 104 of the 2014 BMW annual report below. You can navigate through the pages in the report by either clicking on the pages listed below, or by using the keyword search tool below to find specific information within the annual report.-
 1
1 -
2
-
3
-
4
-
5
-
6
-
7
-
8
-
9
-
10
-
11
-
12
-
13
-
14
-
15
-
16
-
17
-
18
-
19
-
20
-
21
-
22
-
23
-
24
-
25
-
26
-
27
-
28
-
29
-
30
-
31
-
32
-
33
-
34
-
35
-
36
-
37
-
38
-
39
-
40
-
41
-
42
-
43
-
44
-
45
-
46
-
47
-
48
-
49
-
50
-
51
-
52
-
53
-
54
-
55
-
56
-
57
-
58
-
59
-
60
-
61
-
62
-
63
-
64
-
65
-
66
-
67
-
68
-
69
-
70
-
71
-
72
-
73
-
74
-
75
-
76
-
77
-
78
-
79
-
80
-
81
-
82
-
83
-
84
-
85
-
86
-
87
-
88
-
89
-
90
-
91
-
92
-
93
-
 94
94 -
 95
95 -
 96
96 -
 97
97 -
 98
98 -
 99
99 -
 100
100 -
 101
101 -
 102
102 -
 103
103 -
 104
104 -
 105
105 -
 106
106 -
 107
107 -
 108
108 -
 109
109 -
 110
110 -
 111
111 -
 112
112 -
 113
113 -
 114
114 -
115
-
116
-
117
-
118
-
119
-
120
-
121
-
122
-
123
-
124
-
125
-
126
-
127
-
128
-
129
-
130
-
131
-
132
-
133
-
134
-
135
-
136
-
137
-
138
-
139
-
140
-
141
-
142
-
143
-
144
-
145
-
146
-
147
-
148
-
149
-
150
-
151
-
152
-
153
-
154
-
155
-
156
-
157
-
158
-
159
-
160
-
161
-
162
-
163
-
164
-
165
-
166
-
167
-
168
-
169
-
170
-
171
-
172
-
173
-
174
-
175
-
176
-
177
-
178
-
179
-
180
-
181
-
182
-
183
-
184
-
185
-
186
-
187
-
188
-
189
-
190
-
191
-
192
-
193
-
194
-
195
-
196
-
197
-
198
-
199
-
200
-
201
-
202
-
203
-
204
-
205
-
206
-
207
-
208
-
209
-
210
-
211
-
212
 |
 |

104
90 GROUP FINANCIAL STATEMENTS
90 Income Statements
90 Statement of
Comprehensive Income
92 Balance Sheets
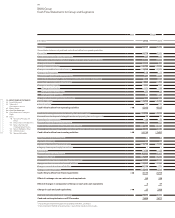
94 Cash Flow Statements
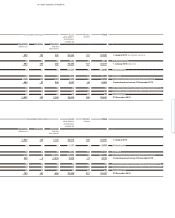
96 Group Statement of Changes in
Equity
98 Notes
98 Accounting Principles and
Policies
116 Notes to the Income Statement
123 Notes to the Statement
of Comprehensive Income
124
Notes to the Balance Sheet
149 Other Disclosures
165 Segment Information
use corresponds to the present value of future cash
flows expected to be derived from an asset or group of
assets.
The first step of the impairment test is to determine the
value in use of an asset. If the calculated value in use is
lower than the carrying amount of the asset, then its fair
value less costs to sell are also determined. If the latter
is also lower than the carrying amount of the asset, then
an impairment loss is recorded, reducing the carrying
amount to the higher of the asset’s value in use or fair
value less costs to sell. The value in use is determined
on the basis of a present value computation. Cash flows
used for the purposes of this calculation are derived
from long-term forecasts approved by management. The
long-term forecasts themselves are based on detailed
forecasts drawn up at an operational level and, based on
a planning period of six years, correspond roughly to
a typical product’s life-cycle. For the purposes of calcu-
lating cash flows beyond the planning period, the as-
set’s assumed residual value does not take growth into
account. Forecasting assumptions are continually
brought
up to date and regularly compared with exter-
nal sources of information. The assumptions used take
account in particular of expectations of the profitability
of the product portfolio,
future market share develop-
ments, macro-economic developments (such as currency,
interest rate and raw materials prices) as well as the le-
gal environment and past experience. Cash flows of the
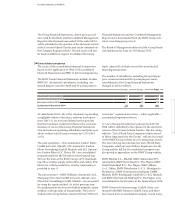
Automotive and Motorcycles CGUs are discounted us-
ing a risk-adjusted pre-tax weighted average cost of cap-
ital (WACC) of 12.0 % (2013: 12.0 %). In the case of the
Financial Services CGU, a sector-compatible pre-tax cost
of equity capital of 13.4 % (2013: 13.4 %) is applied. In
conjunction
with the impairment tests for CGUs, sensi-
tivity analyses are performed for the main assumptions.
Analyses performed in the year under report confirmed,
as in the previous year, that no impairment loss was re-
quired to be recognised.
If the reason for a previously recognised impairment loss
no longer exists, the impairment loss is reversed up to
the level of the recoverable amount, capped at the level
of rolled-forward amortised cost. This does not apply
to goodwill: previously recognised impairment losses on
goodwill are not reversed.
Investments accounted for using the equity method are
(except when the investment is impaired) measured at
the Group’s share of equity taking account of fair value
adjustments on acquisition. Investments accounted for
using the equity method comprise joint ventures and
significant associated companies.
Investments in non-consolidated Group companies and
interests in associated companies not accounted for using
the equity method are reported as Other investments and
measured at cost or, if lower, at their fair value.
Participations are measured at their fair value. If this
value is not available or cannot be determined reliably,
participations are measured at cost.
Non-current marketable securities are measured ac-
cording to the category of financial asset to which they
are classified. No held-for-trading financial assets are
included under this heading.
A financial instrument is a contract that gives rise to a
finan cial asset of one entity and a financial liability
or equity instrument of another entity. Once a BMW
Group entity becomes party to such to a contract, the
financial instrument is recognised either as a financial
asset or as a financial liability.
Financial assets are accounted for on the basis of the
settlement date. On initial recognition, they are meas-
ured at their fair value. Transaction costs are included
in the fair value unless the financial assets are allocated
to the category “financial assets measured at fair value
through profit or loss”.
Subsequent to initial recognition, available-for-sale and
held-for-trading financial assets are measured at their
fair value. When market prices are not available, the fair
value of available-for-sale financial assets is measured
using appropriate valuation techniques e. g. discounted
cash flow analysis based on market information available
at the balance sheet date.
Available-for-sale assets include non-current investments,
securities and investment fund shares. This category
includes all non-derivative financial assets which are