BMW 2014 Annual Report Download - page 58
Download and view the complete annual report
Please find page 58 of the 2014 BMW annual report below. You can navigate through the pages in the report by either clicking on the pages listed below, or by using the keyword search tool below to find specific information within the annual report.-
 1
1 -
2
-
3
-
4
-
5
-
6
-
7
-
8
-
9
-
10
-
11
-
12
-
13
-
14
-
15
-
16
-
17
-
18
-
19
-
20
-
21
-
22
-
23
-
24
-
25
-
26
-
27
-
28
-
29
-
30
-
31
-
32
-
33
-
34
-
35
-
36
-
37
-
38
-
39
-
40
-
41
-
42
-
43
-
44
-
45
-
46
-
47
-
 48
48 -
 49
49 -
 50
50 -
 51
51 -
 52
52 -
 53
53 -
 54
54 -
 55
55 -
 56
56 -
 57
57 -
 58
58 -
 59
59 -
 60
60 -
 61
61 -
 62
62 -
 63
63 -
 64
64 -
 65
65 -
 66
66 -
 67
67 -
 68
68 -
69
-
70
-
71
-
72
-
73
-
74
-
75
-
76
-
77
-
78
-
79
-
80
-
81
-
82
-
83
-
84
-
85
-
86
-
87
-
88
-
89
-
90
-
91
-
92
-
93
-
94
-
95
-
96
-
97
-
98
-
99
-
100
-
101
-
102
-
103
-
104
-
105
-
106
-
107
-
108
-
109
-
110
-
111
-
112
-
113
-
114
-
115
-
116
-
117
-
118
-
119
-
120
-
121
-
122
-
123
-
124
-
125
-
126
-
127
-
128
-
129
-
130
-
131
-
132
-
133
-
134
-
135
-
136
-
137
-
138
-
139
-
140
-
141
-
142
-
143
-
144
-
145
-
146
-
147
-
148
-
149
-
150
-
151
-
152
-
153
-
154
-
155
-
156
-
157
-
158
-
159
-
160
-
161
-
162
-
163
-
164
-
165
-
166
-
167
-
168
-
169
-
170
-
171
-
172
-
173
-
174
-
175
-
176
-
177
-
178
-
179
-
180
-
181
-
182
-
183
-
184
-
185
-
186
-
187
-
188
-
189
-
190
-
191
-
192
-
193
-
194
-
195
-
196
-
197
-
198
-
199
-
200
-
201
-
202
-
203
-
204
-
205
-
206
-
207
-
208
-
209
-
210
-
211
-
212
 |
 |

58
18 COMBINED MANAGEMENT REPORT
18
General Information on the
BMW
Group
18 Business Model
20 Management System
23 Report on Economic Position
23 General and Sector-specific
Environment
26 Overall Assessment by Management
26
Financial and Non-financial
Performance Indicators
29 Review of Operations
49 Results of Operations, Financial
Position and Net Assets
61 Comments on Financial Statements
of BMW AG
64 Events after the End of the
Reporting Period
65 Report on Outlook, Risks and
Opportunities
65 Outlook
70 Report on Risks and Opportunities
82 Internal Control System and Risk
Management System Relevant for
the
Consolidated Financial Reporting Process
83 Disclosures Relevant for Takeovers
and Explanatory Comments
87
BMW Stock and Capital Markets
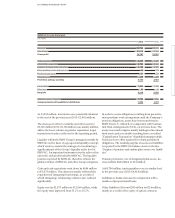
Income and expenses relating to equity accounted in-
vestments and recognised directly in equity (before tax)
reduced equity by € 48 million.
The dividend payment decreased equity by € 1,707 mil-
lion.
Minority interests increased by € 29 million. A
portion of the Authorised Capital 2014 created at the
Annual General Meeting held on 14 May 2009 in
con-
junction with the Employee Share Programme was used
during the financial year under report to issue shares
of
preferred stock to employees. An amount of € 15 mil-
lion was transferred to capital reserves in conjunction
with this share capital increase.
The equity ratio of the BMW Group fell overall by 1.5 per-
centage
points to 24.2 %. The equity ratio of the
Auto-
motive segment was 39.2 % (2013: 42.4 %) and that of the
Financial Services segment was 8.8 % (2013: 9.1 %).
Other provisions increased from € 7,240 million to
€ 8,790 million during the year under report, mainly re-
flecting allocations to provisions for personnel-related
expenses and ongoing operational expenses as well as
the reclassification described in note 31.
The € 711 million increase in current other liabilities
was
attributable to the expansion of service and leasing busi-
ness and the related impact on amounts recognised as
deferred income. In addition, value added tax payables
were higher than at the end of the previous financial
year as a result of the higher volume of vehicles sold.
Deferred tax liabilities fell by € 485 million to € 1,974
mil-
lion as a result of lower fair values of derivative financial
instruments recognised directly in equity,
remeasure-
ments of the net defined benefit liability for pension
plans and currency factors. The € 729 million decrease
in current tax liabilities to € 1,590 million was mainly at-
tributable to a tax payment in the USA.
Overall, the results of operations, financial position and
net assets position of the BMW Group continued to de-
velop positively during the financial year under report.
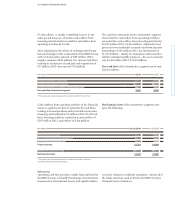
Compensation Report
The compensation of the Board of Management com-
prises both a fixed and a variable component. Benefits
are also payable – primarily in the form of pension
benefits – at the end of members’ mandates. Further
details, including an analysis of remuneration by each
individual, are disclosed in the Compensation Report,
which can be found in the section “Statement on Corpo-
rate Governance”. The Compensation Report is a sub-
section of the Combined Management Report.
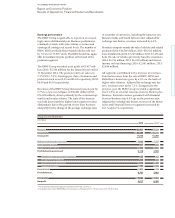
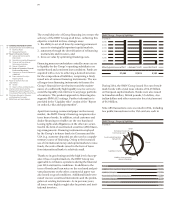
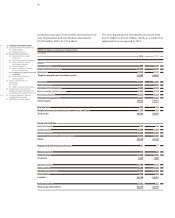
Value added statement*
The value added statement shows the value of work per-
formed less the value of work bought in by the BMW
Group during the financial year. Depreciation and amor-
tisation,
cost of materials and other expenses are treated
as bought-in costs in the value added calculation. The
allocation statement applies value added to each of the
participants involved in the value added process. It
should be noted that the gross value added amount treats
depreciation as a component of value added which, in
the allocation statement, is treated as internal financing.
Net value added by the BMW Group in 2014 increased
by 7.3 % to € 20,620 million and was once again at a high
level.
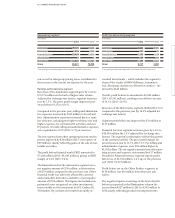
The bulk of the net value added (47.4 %) is again applied
to employees. The proportion applied to providers of
finance fell to 8.4 %, mainly due to the lower refinancing
costs on international capital markets for the financial
services side of the business. The government / public
sector (including deferred tax expense) accounted for
16.0 %. The proportion of net value added applied to
shareholders, at 9.2 %, was higher than in the previous
year. Minority interests take a 0.1 % share of net value
added. The remaining proportion of net value added
(18.9 %) will be retained in the Group to finance future
operations.
* Prior year figures have been adjusted in accordance with IAS 8, see note 9.