BMW 2014 Annual Report Download - page 127
Download and view the complete annual report
Please find page 127 of the 2014 BMW annual report below. You can navigate through the pages in the report by either clicking on the pages listed below, or by using the keyword search tool below to find specific information within the annual report.-
 1
1 -
2
-
3
-
4
-
5
-
6
-
7
-
8
-
9
-
10
-
11
-
12
-
13
-
14
-
15
-
16
-
17
-
18
-
19
-
20
-
21
-
22
-
23
-
24
-
25
-
26
-
27
-
28
-
29
-
30
-
31
-
32
-
33
-
34
-
35
-
36
-
37
-
38
-
39
-
40
-
41
-
42
-
43
-
44
-
45
-
46
-
47
-
48
-
49
-
50
-
51
-
52
-
53
-
54
-
55
-
56
-
57
-
58
-
59
-
60
-
61
-
62
-
63
-
64
-
65
-
66
-
67
-
68
-
69
-
70
-
71
-
72
-
73
-
74
-
75
-
76
-
77
-
78
-
79
-
80
-
81
-
82
-
83
-
84
-
85
-
86
-
87
-
88
-
89
-
90
-
91
-
92
-
93
-
94
-
95
-
96
-
97
-
98
-
99
-
100
-
101
-
102
-
103
-
104
-
105
-
106
-
107
-
108
-
109
-
110
-
111
-
112
-
113
-
114
-
115
-
116
-
 117
117 -
 118
118 -
 119
119 -
 120
120 -
 121
121 -
 122
122 -
 123
123 -
 124
124 -
 125
125 -
 126
126 -
 127
127 -
 128
128 -
 129
129 -
 130
130 -
 131
131 -
 132
132 -
 133
133 -
 134
134 -
 135
135 -
 136
136 -
 137
137 -
138
-
139
-
140
-
141
-
142
-
143
-
144
-
145
-
146
-
147
-
148
-
149
-
150
-
151
-
152
-
153
-
154
-
155
-
156
-
157
-
158
-
159
-
160
-
161
-
162
-
163
-
164
-
165
-
166
-
167
-
168
-
169
-
170
-
171
-
172
-
173
-
174
-
175
-
176
-
177
-
178
-
179
-
180
-
181
-
182
-
183
-
184
-
185
-
186
-
187
-
188
-
189
-
190
-
191
-
192
-
193
-
194
-
195
-
196
-
197
-
198
-
199
-
200
-
201
-
202
-
203
-
204
-
205
-
206
-
207
-
208
-
209
-
210
-
211
-
212
 |
 |

127 GROUP FINANCIAL STATEMENTS
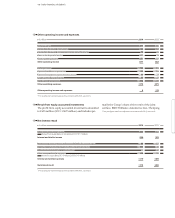
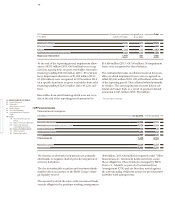
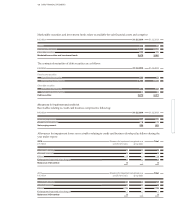
in € million 31. 12. 2014 31. 12. 2013
within one year 7,267 6,314
between one and five years 7,442 6,587
later than five years 3 5
Minimum lease payments 14,712 12,906
25
26
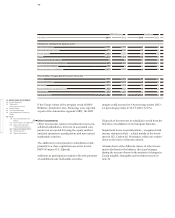
Leased products
The BMW Group, as lessor, leases out its own products
and those of other manufacturers as part of its finan-
cial
services business. Minimum lease payments of
€ 14,712 million (2013: € 12,906 million) from non-can-
cellable operating leases fall due as follows:
Contingent rents of € 56 million (2013: € 171 million),
based principally on the distance driven, were recog-
nised in income. Some of the agreements contain price
adjustment clauses as well as extension and purchase
options.
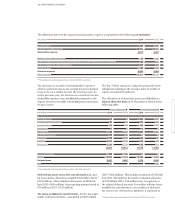
Impairment losses recognised on leased products
totalled € 137 million (2013: € 139 million), while
rever-
sals of impairment losses totalled € 44 million (2013:
€ 104 million).
An analysis of changes in leased products is provided in
note 22.
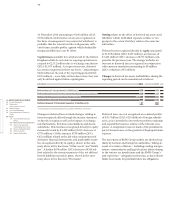
Investments accounted for using the equity method
Investments accounted for using the equity method re-
late to the joint ventures BMW Brilliance Automotive
Ltd., Shenyang (BMW Brilliance) on the one hand and
DriveNow GmbH & Co. KG, Munich, and DriveNow
Verwaltungs GmbH, Munich, (DriveNow) on the other.
The BMW Brilliance Automotive Ltd., Shenyang, joint
venture (in which BMW has a 50 % shareholding)
produces various BMW brand models for the Chinese
market and also has engine manufacturing facilities,
which supply the joint venture’s two plants with petrol
engines.
The DriveNow joint venture – comprising DriveNow
GmbH & Co. KG, Munich, and DriveNow Verwaltungs
GmbH, Munich, (both 50 % shareholdings) – is a car
sharing provider which currently offers individual mo-
bility services in major German cities and, going for-
ward,
increasingly outside Germany.
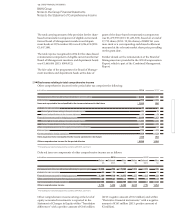
The accounting treatment applied to investments
accounted for using the equity method is described in
note 6. Financial information relating to equity ac-
counted investments is aggregated in the following
table:
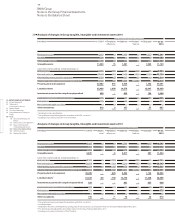
BMW Brilliance DriveNow
in € million 2014 2013 2014 2013
Disclosures relating to the income statement
Revenues 11,550 8,963 32 18
Scheduled depreciation 247 157 – –
Profit / loss before financial result 1,702 1,096 – 5 – 6
Interest income 24 16 – –
Interest expenses – – – –
Income taxes 449 285 – –
Other comprehensive income – – – –
Total comprehensive income 1,339 834 – 5 – 7
Dividends received by the Group 147 127 – –