BMW 2014 Annual Report Download - page 52
Download and view the complete annual report
Please find page 52 of the 2014 BMW annual report below. You can navigate through the pages in the report by either clicking on the pages listed below, or by using the keyword search tool below to find specific information within the annual report.-
 1
1 -
2
-
3
-
4
-
5
-
6
-
7
-
8
-
9
-
10
-
11
-
12
-
13
-
14
-
15
-
16
-
17
-
18
-
19
-
20
-
21
-
22
-
23
-
24
-
25
-
26
-
27
-
28
-
29
-
30
-
31
-
32
-
33
-
34
-
35
-
36
-
37
-
38
-
39
-
40
-
41
-
 42
42 -
 43
43 -
 44
44 -
 45
45 -
 46
46 -
 47
47 -
 48
48 -
 49
49 -
 50
50 -
 51
51 -
 52
52 -
 53
53 -
 54
54 -
 55
55 -
 56
56 -
 57
57 -
 58
58 -
 59
59 -
 60
60 -
 61
61 -
 62
62 -
63
-
64
-
65
-
66
-
67
-
68
-
69
-
70
-
71
-
72
-
73
-
74
-
75
-
76
-
77
-
78
-
79
-
80
-
81
-
82
-
83
-
84
-
85
-
86
-
87
-
88
-
89
-
90
-
91
-
92
-
93
-
94
-
95
-
96
-
97
-
98
-
99
-
100
-
101
-
102
-
103
-
104
-
105
-
106
-
107
-
108
-
109
-
110
-
111
-
112
-
113
-
114
-
115
-
116
-
117
-
118
-
119
-
120
-
121
-
122
-
123
-
124
-
125
-
126
-
127
-
128
-
129
-
130
-
131
-
132
-
133
-
134
-
135
-
136
-
137
-
138
-
139
-
140
-
141
-
142
-
143
-
144
-
145
-
146
-
147
-
148
-
149
-
150
-
151
-
152
-
153
-
154
-
155
-
156
-
157
-
158
-
159
-
160
-
161
-
162
-
163
-
164
-
165
-
166
-
167
-
168
-
169
-
170
-
171
-
172
-
173
-
174
-
175
-
176
-
177
-
178
-
179
-
180
-
181
-
182
-
183
-
184
-
185
-
186
-
187
-
188
-
189
-
190
-
191
-
192
-
193
-
194
-
195
-
196
-
197
-
198
-
199
-
200
-
201
-
202
-
203
-
204
-
205
-
206
-
207
-
208
-
209
-
210
-
211
-
212
 |
 |

52
18 COMBINED MANAGEMENT REPORT
18
General Information on the
BMW
Group
18 Business Model
20 Management System
23 Report on Economic Position
23 General and Sector-specific
Environment
26 Overall Assessment by Management
26
Financial and Non-financial
Performance Indicators
29 Review of Operations
49 Results of Operations, Financial
Position and Net Assets
61 Comments on Financial Statements
of BMW AG
64 Events after the End of the
Reporting Period
65 Report on Outlook, Risks and
Opportunities
65 Outlook
70 Report on Risks and Opportunities
82 Internal Control System and Risk
Management System Relevant for
the
Consolidated Financial Reporting Process
83 Disclosures Relevant for Takeovers
and Explanatory Comments
87
BMW Stock and Capital Markets
within the leased products portfolio and partly due to
elimination reversal effects.
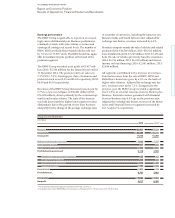
Financial position*
The consolidated cash flow statements for the Group
and the Automotive and Financial Services segments
show the sources and applications of cash flows for the
financial years 2014 and 2013, classified into cash flows
from operating, investing and financing activities.
Cash
and cash equivalents in the cash flow statements
correspond to the amount disclosed in the balance
sheet.
Cash flows from operating activities are determined in-
directly, starting with Group and segment net profit.
By contrast, cash flows from investing and financing
activities are based on actual payments and receipts.
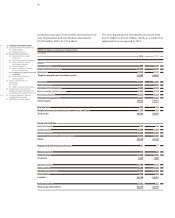
The cash inflow from operating activities in 2014 de-
creased by € 1,215 million to € 2,912 million. This dete-
rioration was mainly due to higher cash outflows for
taxes
(up by € 1,465 million) and included, among other
items, a tax payment in the USA.
The cash outflow for investing activities amounted to
€ 6,116 million (2013: € 7,491 million) and was therefore
18.4 % down on the previous year, primarily reflecting a
€ 594 million reduction in investments in property, plant
and equipment and intangible assets (2014: € 6,099 mil-
lion) and a € 737 million reduction in the net outflow for
investments in marketable securities and term deposits
(2014: net outflow of € 144 million).
Further information on investments is provided in the
section on the net assets position.
Cash inflow from financing activities totalled € 3,133 mil-
lion
(2013: € 2,703 million). Proceeds from the issue of
bonds amounted to € 10,892 million (2013: € 8,982 mil-
lion), compared with an outflow of € 7,249 million (2013:
€ 7,242 million) for the repayment of bonds. Non-cur-
rent other financial liabilities resulted in a cash inflow
of € 5,900 million (2013: € 6,626 million) and a cash
outflow of € 5,697 million (2013: € 4,996 million). The
net cash inflow for current other financial liabilities
was € 2,132 million (2013: net cash outflow of € 721 mil-
lion).
The change in commercial paper gave rise to
a net cash outflow of € 1,012 million (2013: net cash
inflow of € 1,812 million). The payment of dividends
resulted in a cash outflow of € 1,715 million (2013:
€ 1,653 million).
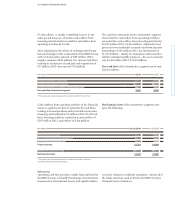
The cash outflow from investing activities exceeded
the cash inflow from operating activities in 2014 by
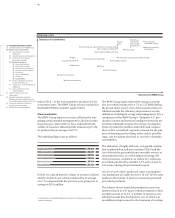
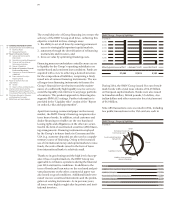
Change in cash and cash equivalents
in € million
11,000
10,000
9,000
8,000
7,000
6,000
5,000
4,000
3,000
2,000
1,000
Cash and cash Cash inflow Cash outflow Cash inflow Currency trans- Cash and cash
equivalents from operating from investing from financing lation, changes in equivalents
31.12. 2013* activities activities activities Group composition 31.12. 2014
7,671 + 2,912 – 6,116 + 3,133 + 88 7,688
* Prior year figures have been adjusted in accordance with IAS 8, see note 9.
* Prior year figures have been adjusted in accordance with IAS 8, see note 9.