BMW 2014 Annual Report Download - page 201
Download and view the complete annual report
Please find page 201 of the 2014 BMW annual report below. You can navigate through the pages in the report by either clicking on the pages listed below, or by using the keyword search tool below to find specific information within the annual report.-
 1
1 -
2
-
3
-
4
-
5
-
6
-
7
-
8
-
9
-
10
-
11
-
12
-
13
-
14
-
15
-
16
-
17
-
18
-
19
-
20
-
21
-
22
-
23
-
24
-
25
-
26
-
27
-
28
-
29
-
30
-
31
-
32
-
33
-
34
-
35
-
36
-
37
-
38
-
39
-
40
-
41
-
42
-
43
-
44
-
45
-
46
-
47
-
48
-
49
-
50
-
51
-
52
-
53
-
54
-
55
-
56
-
57
-
58
-
59
-
60
-
61
-
62
-
63
-
64
-
65
-
66
-
67
-
68
-
69
-
70
-
71
-
72
-
73
-
74
-
75
-
76
-
77
-
78
-
79
-
80
-
81
-
82
-
83
-
84
-
85
-
86
-
87
-
88
-
89
-
90
-
91
-
92
-
93
-
94
-
95
-
96
-
97
-
98
-
99
-
100
-
101
-
102
-
103
-
104
-
105
-
106
-
107
-
108
-
109
-
110
-
111
-
112
-
113
-
114
-
115
-
116
-
117
-
118
-
119
-
120
-
121
-
122
-
123
-
124
-
125
-
126
-
127
-
128
-
129
-
130
-
131
-
132
-
133
-
134
-
135
-
136
-
137
-
138
-
139
-
140
-
141
-
142
-
143
-
144
-
145
-
146
-
147
-
148
-
149
-
150
-
151
-
152
-
153
-
154
-
155
-
156
-
157
-
158
-
159
-
160
-
161
-
162
-
163
-
164
-
165
-
166
-
167
-
168
-
169
-
170
-
171
-
172
-
173
-
174
-
175
-
176
-
177
-
178
-
179
-
180
-
181
-
182
-
183
-
184
-
185
-
186
-
187
-
188
-
189
-
190
-
 191
191 -
 192
192 -
 193
193 -
 194
194 -
 195
195 -
 196
196 -
 197
197 -
 198
198 -
 199
199 -
 200
200 -
 201
201 -
 202
202 -
 203
203 -
 204
204 -
 205
205 -
 206
206 -
 207
207 -
 208
208 -
 209
209 -
 210
210 -
 211
211 -
212
 |
 |

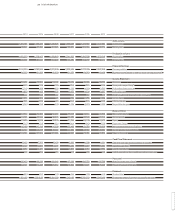
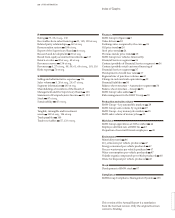
201 OTHER INFORMATION
2010 2009 2008 2007 2006 2005
Sales volume
1,461,166 1,286,310 1,435,876 1,500,678 1,373,970 1,327,992 Automobiles
98,047 87,306 101,685 102,467 100,064 97,474 Motorcycles1
Production volume
1,481,253 1,258,417 1,439,918 1,541,503 1,366,838 1,323,119 Automobiles
99,236 82,631 104,220 104,396 103,759 92,012 Motorcycles1
Financial Services
3,190,353 3,085,946 3,031,935 2,629,949 2,270,528 2,087,368 Contract portfolio
66,233 61,202 60,653 51,257 44,010 40,428 Business volume (based on balance sheet carrying amounts)2
Income Statement
60,477 50,681 53,197 56,018 48,999 46,656 Revenues
18.1 10.5 11.4 21.8 23.1 22.9 Gross profit margin Group4
5,111 289 921 4,212 4,050 3,793 Profit before financial result
4,853 413 351 3,873 4,124 3,287 Profit before tax
8.0 0.8 0.7 6.9 8.4 7.0 Return on sales (earnings before tax / revenues)
1,610 203 21 739 1,250 1,048 Income taxes
33.1 49.2 6.0 19.1 30.3 31.9 Effective tax rate
3,243 210 330 3,134 2,874 2,239 Net profit for the year
Balance Sheet
67,013 62,009 62,416 56,619 50,514 47,556 Non-current assets
43,151 39,944 38,670 32,378 28,543 27,010 Current assets
23,930 19,915 20,273 21,744 19,130 16,973 Equity
21.7 19.5 20.1 24.4 24.2 22.8 Equity ratio Group
46,100 45,119 41,526 33,469 31,372 29,509 Non-current provisions and liabilities
40,134 36,919 39,287 33,784 28,555 28,084 Current provisions and liabilities
110,164 101,953 101,086 88,997 79,057 74,566 Balance sheet total
Cash Flow Statement
7,432 7,767 7,454 2,393 1,336 1,621 Cash and cash equivalents at balance sheet date
8,149 4,921 4,471 6,246 5,373 6,184 Operating cash flow 5
3,263 3,471 4,204 4,267 4,313 3,993 Capital expenditure
5.4 6.8 7.9 7.6 8.8 8.6 Capital expenditure ratio (capital expenditure / revenues)
Personnel
95,453 96,230 100,041 107,539 106,575 105,798 Workforce at the end of year6
83,141 72,349 75,612 76,704 76,621 75,238 Personnel cost per employee
Dividend
852 197 197 694 458 419 Dividend total
1.30 / 1.32 0.30 / 0.32 0.30 / 0.32 1.06 / 1.08 0.70 / 0.72 0.64 / 0.66 Dividend per share of common stock / preferred stock