BMW 2014 Annual Report Download - page 53
Download and view the complete annual report
Please find page 53 of the 2014 BMW annual report below. You can navigate through the pages in the report by either clicking on the pages listed below, or by using the keyword search tool below to find specific information within the annual report.-
 1
1 -
2
-
3
-
4
-
5
-
6
-
7
-
8
-
9
-
10
-
11
-
12
-
13
-
14
-
15
-
16
-
17
-
18
-
19
-
20
-
21
-
22
-
23
-
24
-
25
-
26
-
27
-
28
-
29
-
30
-
31
-
32
-
33
-
34
-
35
-
36
-
37
-
38
-
39
-
40
-
41
-
42
-
 43
43 -
 44
44 -
 45
45 -
 46
46 -
 47
47 -
 48
48 -
 49
49 -
 50
50 -
 51
51 -
 52
52 -
 53
53 -
 54
54 -
 55
55 -
 56
56 -
 57
57 -
 58
58 -
 59
59 -
 60
60 -
 61
61 -
 62
62 -
 63
63 -
64
-
65
-
66
-
67
-
68
-
69
-
70
-
71
-
72
-
73
-
74
-
75
-
76
-
77
-
78
-
79
-
80
-
81
-
82
-
83
-
84
-
85
-
86
-
87
-
88
-
89
-
90
-
91
-
92
-
93
-
94
-
95
-
96
-
97
-
98
-
99
-
100
-
101
-
102
-
103
-
104
-
105
-
106
-
107
-
108
-
109
-
110
-
111
-
112
-
113
-
114
-
115
-
116
-
117
-
118
-
119
-
120
-
121
-
122
-
123
-
124
-
125
-
126
-
127
-
128
-
129
-
130
-
131
-
132
-
133
-
134
-
135
-
136
-
137
-
138
-
139
-
140
-
141
-
142
-
143
-
144
-
145
-
146
-
147
-
148
-
149
-
150
-
151
-
152
-
153
-
154
-
155
-
156
-
157
-
158
-
159
-
160
-
161
-
162
-
163
-
164
-
165
-
166
-
167
-
168
-
169
-
170
-
171
-
172
-
173
-
174
-
175
-
176
-
177
-
178
-
179
-
180
-
181
-
182
-
183
-
184
-
185
-
186
-
187
-
188
-
189
-
190
-
191
-
192
-
193
-
194
-
195
-
196
-
197
-
198
-
199
-
200
-
201
-
202
-
203
-
204
-
205
-
206
-
207
-
208
-
209
-
210
-
211
-
212
 |
 |

53 COMBINED MANAGEMENT REPORT
Cash outflows from operating activities of the Financial
Services segment are driven primarily by cash flows
relating to leased products and receivables from sales
financing and totalled € 4,715 million (2013: € 5,358 mil-
lion). Investing activities resulted in a cash outflow of
€ 297 million (2013: cash inflow of € 324 million).
Refinancing
Operating cash flow provides a stable financial basis for
the BMW Group. A broadly based range of instruments
transacted on international money and capital markets
€ 3,204 million. A similar constellation arose in the
same period last year, when the cash outflow from
investing activities had exceeded the cash inflow from
operating activities by € 3,364.
After adjusting for the effects of exchange-rate
fluctua-
tions and changes in the composition of the BMW Group
with a total positive amount of € 88 million (2013:
negative amount of € 42 million), the various cash flows
resulted in an increase of cash and cash equivalents of
€ 17 million (2013: decrease of € 703 million).
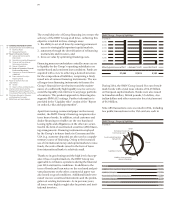
Net financial assets of the Automotive segment com-
prise the following:
is used to refinance worldwide operations. Almost all of
the funds raised are used to finance the BMW Group’s
Financial Services business.
The cash flow statement for the Automotive segment
shows that the cash inflow from operating activities
exceeded the cash outflow from investing activities by
€ 3,587 million (2013: € 1,966 million). Adjusted for net
proceeds from marketable securities and term deposits
amounting to € 106 million (2013: net investments of
€ 1,037 million) – mainly in conjunction with securities
held for strategic liquidity purposes – the excess amount
was € 3,481 million (2013: € 3,003 million).
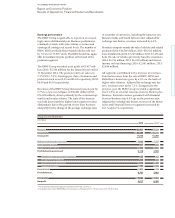
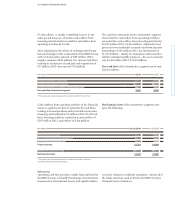
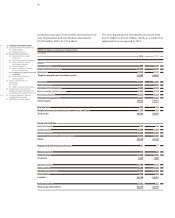
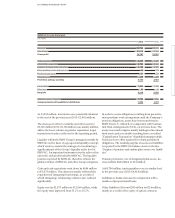
Free cash flow of the Automotive segment can be ana-
lysed
as follows:
in € million 2014 2013*
Cash inflow from operating activities 9,423 9,964
Cash outflow from investing activities – 5,836 – 7,998
Net investment in marketable securities and term deposits – 106 1,037
Free cash flow Automotive segment 3,481 3,003
* Prior year figures have been adjusted in accordance with IAS 8, see note 9.
in € million 31.12. 2014 31.12. 20131
Cash and cash equivalents 5,752 6,775
Marketable securities and investment funds 3,366 2,758
Intragroup net financial receivables 8,583 4,411
Financial assets 17,701 13,944
Less: external financial liabilities2 – 3,478 – 1,859
Net financial assets 14,223 12,085
1 Prior year figures have been adjusted in accordance with IAS 8, see note 9.
2 Excluding derivative financial instruments.