BMW 2014 Annual Report Download - page 133
Download and view the complete annual report
Please find page 133 of the 2014 BMW annual report below. You can navigate through the pages in the report by either clicking on the pages listed below, or by using the keyword search tool below to find specific information within the annual report.-
 1
1 -
2
-
3
-
4
-
5
-
6
-
7
-
8
-
9
-
10
-
11
-
12
-
13
-
14
-
15
-
16
-
17
-
18
-
19
-
20
-
21
-
22
-
23
-
24
-
25
-
26
-
27
-
28
-
29
-
30
-
31
-
32
-
33
-
34
-
35
-
36
-
37
-
38
-
39
-
40
-
41
-
42
-
43
-
44
-
45
-
46
-
47
-
48
-
49
-
50
-
51
-
52
-
53
-
54
-
55
-
56
-
57
-
58
-
59
-
60
-
61
-
62
-
63
-
64
-
65
-
66
-
67
-
68
-
69
-
70
-
71
-
72
-
73
-
74
-
75
-
76
-
77
-
78
-
79
-
80
-
81
-
82
-
83
-
84
-
85
-
86
-
87
-
88
-
89
-
90
-
91
-
92
-
93
-
94
-
95
-
96
-
97
-
98
-
99
-
100
-
101
-
102
-
103
-
104
-
105
-
106
-
107
-
108
-
109
-
110
-
111
-
112
-
113
-
114
-
115
-
116
-
117
-
118
-
119
-
120
-
121
-
122
-
 123
123 -
 124
124 -
 125
125 -
 126
126 -
 127
127 -
 128
128 -
 129
129 -
 130
130 -
 131
131 -
 132
132 -
 133
133 -
 134
134 -
 135
135 -
 136
136 -
 137
137 -
 138
138 -
 139
139 -
 140
140 -
 141
141 -
 142
142 -
 143
143 -
144
-
145
-
146
-
147
-
148
-
149
-
150
-
151
-
152
-
153
-
154
-
155
-
156
-
157
-
158
-
159
-
160
-
161
-
162
-
163
-
164
-
165
-
166
-
167
-
168
-
169
-
170
-
171
-
172
-
173
-
174
-
175
-
176
-
177
-
178
-
179
-
180
-
181
-
182
-
183
-
184
-
185
-
186
-
187
-
188
-
189
-
190
-
191
-
192
-
193
-
194
-
195
-
196
-
197
-
198
-
199
-
200
-
201
-
202
-
203
-
204
-
205
-
206
-
207
-
208
-
209
-
210
-
211
-
212
 |
 |

133 GROUP FINANCIAL STATEMENTS
33
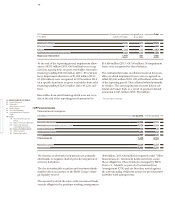
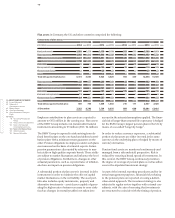
Trade receivables
Trade receivables totalling € 2,153 million (2013: € 2,449 million) include an unchanged amount of € 47 million which
is due later than one year.
in € million 31. 12. 2014 31. 12. 2013
Gross carrying amount 2,236 2,555
Allowance for impairment – 83 – 106
Net carrying amount 2,153 2,449
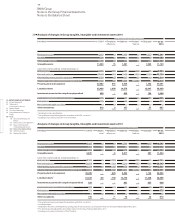
2014 Allowance for impairment recognised on a Total
in € million specific item basis group basis
Balance at 1 January* 98 9 107
Allocated / reversed – 6 – 2 – 8
Utilised – 15 – – 15
Exchange rate impact and other changes – 1 – – 1
Balance at 31 December 76 7 83
* Including entities consolidated for the first time during the financial year.
2013 Allowance for impairment recognised on a Total
in € million specific item basis group basis
Balance at 1 January 105 6 111
Allocated / reversed 2 4 6
Utilised – 8 – – 8
Exchange rate impact and other changes – 2 – 1 – 3
Balance at 31 December 97 9 106
Allowances on trade receivables developed as following during the year under report:
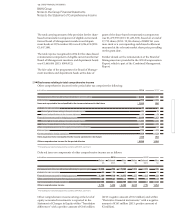
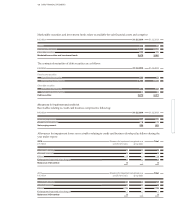
Allowances for impairment and credit risk
in € million 31. 12. 2014 31. 12. 2013
1 – 30 days overdue 100 80
31 – 60 days overdue 73 30
61 – 90 days overdue 26 8
91 – 120 days overdue 30 13
More than 120 days overdue 52 17
281 148
Some trade receivables were overdue for which an impairment loss was not recognised. Overdue balances are
analysed
into the following time windows:
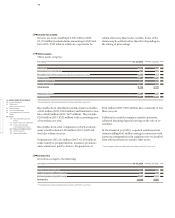
At 31 December 2014, inventories measured at their
net realisable value amounted to € 723 million (2013:
€ 592 million) and are included in total inventories of
€ 11,089 million (2013*: € 9,595 million). Write-downs
to
net realisable value amounting to € 29 million (2013:
€ 28 million) were recognised in 2014. Reversals of
writedowns amounted to € 3 million (2013: € 4 million).
* Prior year figures have been adjusted in accordance with IAS 8, see note 9.