BMW 2014 Annual Report Download - page 47
Download and view the complete annual report
Please find page 47 of the 2014 BMW annual report below. You can navigate through the pages in the report by either clicking on the pages listed below, or by using the keyword search tool below to find specific information within the annual report.-
 1
1 -
2
-
3
-
4
-
5
-
6
-
7
-
8
-
9
-
10
-
11
-
12
-
13
-
14
-
15
-
16
-
17
-
18
-
19
-
20
-
21
-
22
-
23
-
24
-
25
-
26
-
27
-
28
-
29
-
30
-
31
-
32
-
33
-
34
-
35
-
36
-
 37
37 -
 38
38 -
 39
39 -
 40
40 -
 41
41 -
 42
42 -
 43
43 -
 44
44 -
 45
45 -
 46
46 -
 47
47 -
 48
48 -
 49
49 -
 50
50 -
 51
51 -
 52
52 -
 53
53 -
 54
54 -
 55
55 -
 56
56 -
 57
57 -
58
-
59
-
60
-
61
-
62
-
63
-
64
-
65
-
66
-
67
-
68
-
69
-
70
-
71
-
72
-
73
-
74
-
75
-
76
-
77
-
78
-
79
-
80
-
81
-
82
-
83
-
84
-
85
-
86
-
87
-
88
-
89
-
90
-
91
-
92
-
93
-
94
-
95
-
96
-
97
-
98
-
99
-
100
-
101
-
102
-
103
-
104
-
105
-
106
-
107
-
108
-
109
-
110
-
111
-
112
-
113
-
114
-
115
-
116
-
117
-
118
-
119
-
120
-
121
-
122
-
123
-
124
-
125
-
126
-
127
-
128
-
129
-
130
-
131
-
132
-
133
-
134
-
135
-
136
-
137
-
138
-
139
-
140
-
141
-
142
-
143
-
144
-
145
-
146
-
147
-
148
-
149
-
150
-
151
-
152
-
153
-
154
-
155
-
156
-
157
-
158
-
159
-
160
-
161
-
162
-
163
-
164
-
165
-
166
-
167
-
168
-
169
-
170
-
171
-
172
-
173
-
174
-
175
-
176
-
177
-
178
-
179
-
180
-
181
-
182
-
183
-
184
-
185
-
186
-
187
-
188
-
189
-
190
-
191
-
192
-
193
-
194
-
195
-
196
-
197
-
198
-
199
-
200
-
201
-
202
-
203
-
204
-
205
-
206
-
207
-
208
-
209
-
210
-
211
-
212
 |
 |

47 COMBINED MANAGEMENT REPORT
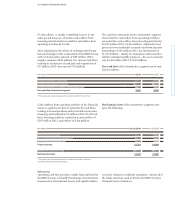
water used in the production of passenger car brake
discs at the Berlin plant.
Solvent emissions were sharply curtailed by 18.9 %
to 1.29 kg per vehicle produced during 2014, which is
mainly due to the fact that in the Chinese plant in
Dadong* the retrofitting of the paint shop with an ex-
haust air cleaning system was reflected in full-year
statistics for the first time.
* Joint venture BMW Brilliance Automotive Ltd., Shenyang.
Sustainability along the entire value chain
Sustainability criteria also play a major role in the selec-
tion and assessment of our suppliers as well as in the
field of transport logistics. The active management of
sustainability risks along the supplier chain reduces com-
pliance
and image risks. With this in mind, the BMW
Group has integrated a comprehensive system of sustain-
ability
management in its purchasing processes.
The amount of energy needed for transportation world-
wide has risen considerably in recent years. In order to
keep CO2 emissions to an absolute minimum, we adhere
to the principle “production follows the market”. More-
over, we are continually increasing the percentage of
low-carbon modes of transport we use. In total, 63.3 %
of all new vehicles left our plants by rail during the twelve-
month period under report (2013: 60.7 %).
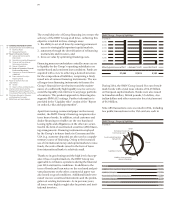
Fleet CO2 emissions again reduced
For many years now, the use of our Efficient Dynamics
technologies in series production has enabled us to
continually reduce the CO2 emissions generated by our
vehicles. Again in 2014, further progress was made in
the electrification of our fleet with the introduction of
the BMW i8 plug-in hybrid sports car and the launching
of the BMW i3 in additional key markets. These meas-
ures form the basis for complying with legally stipulated
CO2 and fuel consumption limits going into the future.
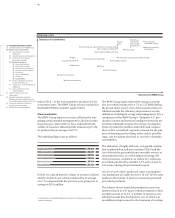
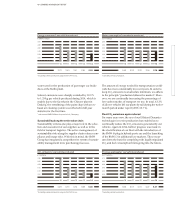
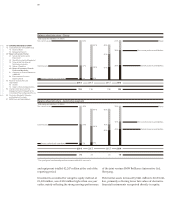
Energy consumed* per vehicle produced
in MWh / vehicle
3.00
2.80
2.60
2.40
2.20
2.00
10 11 12 13 14
2.72 2.43 2.41 2.36 2.25
* Excluding contract production, adjusted for CHP losses.
Water consumption* per vehicle produced
in m3 / vehicle
2.80
2.60
2.40
2.20
2.00
1.80
10 11 12 13 14
2.40 2.25 2.22 2.18 2.18
* Excluding contract production.
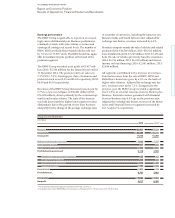
CO2 emissions* per vehicle produced
in t / vehicle
0.90
0.85
0.80
0.75
0.70
0.65
10 11 12 13 14
0.89 0.75 0.72 0.68 0.66
* Excluding contract production, adjusted for CHP losses.
Process wastewater* per vehicle produced
in m3 / vehicle
0.70
0.60
0.50
0.40
0.30
0.20
10 11 12 13 14
0.60 0.57 0.51 0.47 0.47
* Excluding contract production.