BMW 2014 Annual Report Download - page 57
Download and view the complete annual report
Please find page 57 of the 2014 BMW annual report below. You can navigate through the pages in the report by either clicking on the pages listed below, or by using the keyword search tool below to find specific information within the annual report.-
 1
1 -
2
-
3
-
4
-
5
-
6
-
7
-
8
-
9
-
10
-
11
-
12
-
13
-
14
-
15
-
16
-
17
-
18
-
19
-
20
-
21
-
22
-
23
-
24
-
25
-
26
-
27
-
28
-
29
-
30
-
31
-
32
-
33
-
34
-
35
-
36
-
37
-
38
-
39
-
40
-
41
-
42
-
43
-
44
-
45
-
46
-
 47
47 -
 48
48 -
 49
49 -
 50
50 -
 51
51 -
 52
52 -
 53
53 -
 54
54 -
 55
55 -
 56
56 -
 57
57 -
 58
58 -
 59
59 -
 60
60 -
 61
61 -
 62
62 -
 63
63 -
 64
64 -
 65
65 -
 66
66 -
 67
67 -
68
-
69
-
70
-
71
-
72
-
73
-
74
-
75
-
76
-
77
-
78
-
79
-
80
-
81
-
82
-
83
-
84
-
85
-
86
-
87
-
88
-
89
-
90
-
91
-
92
-
93
-
94
-
95
-
96
-
97
-
98
-
99
-
100
-
101
-
102
-
103
-
104
-
105
-
106
-
107
-
108
-
109
-
110
-
111
-
112
-
113
-
114
-
115
-
116
-
117
-
118
-
119
-
120
-
121
-
122
-
123
-
124
-
125
-
126
-
127
-
128
-
129
-
130
-
131
-
132
-
133
-
134
-
135
-
136
-
137
-
138
-
139
-
140
-
141
-
142
-
143
-
144
-
145
-
146
-
147
-
148
-
149
-
150
-
151
-
152
-
153
-
154
-
155
-
156
-
157
-
158
-
159
-
160
-
161
-
162
-
163
-
164
-
165
-
166
-
167
-
168
-
169
-
170
-
171
-
172
-
173
-
174
-
175
-
176
-
177
-
178
-
179
-
180
-
181
-
182
-
183
-
184
-
185
-
186
-
187
-
188
-
189
-
190
-
191
-
192
-
193
-
194
-
195
-
196
-
197
-
198
-
199
-
200
-
201
-
202
-
203
-
204
-
205
-
206
-
207
-
208
-
209
-
210
-
211
-
212
 |
 |

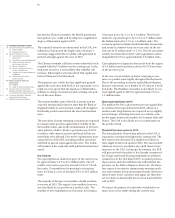
57 COMBINED MANAGEMENT REPORT
remeasurements of the net defined benefit liability for
pension plans and currency factors (in particular relating
to the US dollar).
At € 6,499 million, the carrying amount of intangible as-
sets was € 320 million higher than at 31 December 2013.
Within intangible assets, capitalised development costs
rose by € 431 million. Investments in capitalised develop-
ment costs totalled € 1,499 million in the year under re-
port and were thus significantly lower than in the
pre-
vious year (2013: € 1,744 million). In the previous year,
additions to intangible assets included licenses acquired
for € 379 million which are being amortised on a straight-
line basis over a period of six years. The proportion of
development costs recognised as assets was 32.8 % (2013:
36.4 %). Adjusted for exchange rate factors, intangible
assets increased by 5.1 %. In total, € 1,561 million was in-
vested in intangible assets, most of which related to the
Automotive segment.
Total capital expenditure on intangible assets and prop-
erty, plant and equipment as a percentage of revenues
decreased to 7.6 % (2013: 8.8 %). Capital commitments
for intangible assets totalled € 750 million at the end of
the reporting period.
Noncurrent financial assets decreased by € 569 million
to € 2,024 million, mainly due to lower fair values of cur-
rency derivatives.
Within current assets, receivables from sales financing
grew from € 21,501 million to € 23,586 million, mostly
reflecting the general growth of Financial Services busi-
ness on the one hand and currency factors on the other.
Compared to the end of the previous year, inventories
increased by € 1,494 million (15.6 %) to € 11,089 million
and accounted for 7.2 % (2013: 6.9 %) of total assets. Most
of the increase related to finished goods, including the
impact of stocking up in conjunction with the
introduc-
tion of new models. Adjusted for exchange rate factors,
the increase was 11.6 %.
Current other assets were € 780 million higher than one
year earlier, mainly due to increases in prepayments,
receivables from other companies in which an invest-
ment is held and other taxes as well as the reclassifica-
tion described in note 31. These increases were partly
offset by the decrease in collateral receivables included
in this line item.
Trade receivables – which accounted for 1.4 % of total
assets (2013: 1.8 %) – went down over the twelvemonth
period by € 296 million. Adjusted for exchange rate fac-
tors, they decreased by 15.8 %.
At € 7,688 million, cash and cash equivalents were
almost identical to their level one year earlier (2013:
€ 7,671 million).
The main increase on the equity and liabilities side of
the balance sheet in percentage terms related to
pen-
sion provisions (99.9 %). Increases were also recorded
for non-current and current financial liabilities (9.4 %
and 21.5 % respectively), equity (5.2 %), current and
non-current other provisions (32.5 % and 11.5 % respec-
tively) and current and non-current other liabilities
(10.1 %
and 18.7 % respectively). By contrast, current
tax and deferred tax liabilities went down by 31.4 % and
19.7 % respectively.
Pension provisions jumped by € 2,301 million to
€ 4,604 million, mainly as a result of the lower discount
factors used in Germany, the UK and the USA.
Current and non-current financial liabilities increased
from € 70,304 to € 80,649 million over the twelve-month
period. Within financial liabilities, derivative
instru-
ments went up from € 1,103 million to € 3,143 million,
mostly reflecting the negative impact of
currency and
commodity derivatives. Additional increases within
financial liabilities included ABS transactions (7.5 %),
bonds (16.9 %) and liabilities to banks (34.5 %). By con-
trast, commercial paper decreased by 11.0 %. Adjusted
for exchange rate factors, non-current and current
financial liabilities increased by 5.0 % and 17.1 %
respec-
tively.
Group equity rose by € 1,837 million to € 37,437 million,
increased primarily by the profit attributable to
share-
holders of BMW AG (€ 5,798 million) and currency
translation differences (€ 764 million) and decreased
mainly by remeasurements of the net defined benefit
liability for pension plans (€ 2,298 million) mainly due
to the lower discount rates used in Germany, the United
Kingdom and the USA. Fair value measurement had a
negative impact in the case of derivative financial in-
struments (€ 2,194 million) and a positive impact in the
case of marketable securities (€ 40 million). Deferred
taxes on items recognised directly in equity increased
equity by € 1,438 million.