BMW 2014 Annual Report Download - page 50
Download and view the complete annual report
Please find page 50 of the 2014 BMW annual report below. You can navigate through the pages in the report by either clicking on the pages listed below, or by using the keyword search tool below to find specific information within the annual report.-
 1
1 -
2
-
3
-
4
-
5
-
6
-
7
-
8
-
9
-
10
-
11
-
12
-
13
-
14
-
15
-
16
-
17
-
18
-
19
-
20
-
21
-
22
-
23
-
24
-
25
-
26
-
27
-
28
-
29
-
30
-
31
-
32
-
33
-
34
-
35
-
36
-
37
-
38
-
39
-
 40
40 -
 41
41 -
 42
42 -
 43
43 -
 44
44 -
 45
45 -
 46
46 -
 47
47 -
 48
48 -
 49
49 -
 50
50 -
 51
51 -
 52
52 -
 53
53 -
 54
54 -
 55
55 -
 56
56 -
 57
57 -
 58
58 -
 59
59 -
 60
60 -
61
-
62
-
63
-
64
-
65
-
66
-
67
-
68
-
69
-
70
-
71
-
72
-
73
-
74
-
75
-
76
-
77
-
78
-
79
-
80
-
81
-
82
-
83
-
84
-
85
-
86
-
87
-
88
-
89
-
90
-
91
-
92
-
93
-
94
-
95
-
96
-
97
-
98
-
99
-
100
-
101
-
102
-
103
-
104
-
105
-
106
-
107
-
108
-
109
-
110
-
111
-
112
-
113
-
114
-
115
-
116
-
117
-
118
-
119
-
120
-
121
-
122
-
123
-
124
-
125
-
126
-
127
-
128
-
129
-
130
-
131
-
132
-
133
-
134
-
135
-
136
-
137
-
138
-
139
-
140
-
141
-
142
-
143
-
144
-
145
-
146
-
147
-
148
-
149
-
150
-
151
-
152
-
153
-
154
-
155
-
156
-
157
-
158
-
159
-
160
-
161
-
162
-
163
-
164
-
165
-
166
-
167
-
168
-
169
-
170
-
171
-
172
-
173
-
174
-
175
-
176
-
177
-
178
-
179
-
180
-
181
-
182
-
183
-
184
-
185
-
186
-
187
-
188
-
189
-
190
-
191
-
192
-
193
-
194
-
195
-
196
-
197
-
198
-
199
-
200
-
201
-
202
-
203
-
204
-
205
-
206
-
207
-
208
-
209
-
210
-
211
-
212
 |
 |

50
18 COMBINED MANAGEMENT REPORT
18
General Information on the
BMW
Group
18 Business Model
20 Management System
23 Report on Economic Position
23 General and Sector-specific
Environment
26 Overall Assessment by Management
26
Financial and Non-financial
Performance Indicators
29 Review of Operations
49 Results of Operations, Financial
Position and Net Assets
61 Comments on Financial Statements
of BMW AG
64 Events after the End of the
Reporting Period
65 Report on Outlook, Risks and
Opportunities
65 Outlook
70 Report on Risks and Opportunities
82 Internal Control System and Risk
Management System Relevant for
the
Consolidated Financial Reporting Process
83 Disclosures Relevant for Takeovers
and Explanatory Comments
87
BMW Stock and Capital Markets
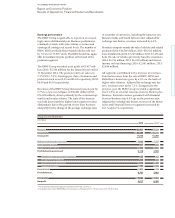
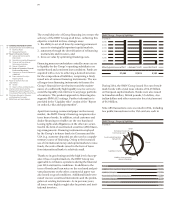
As in the previous year, Group revenues are spread
across all regions, with the Europe region (including
Germany) accounting for 46.8 % (2013: 45.2 %), the
Americas region for 20.7 % (2013: 20.7 %) and the Africa,
Asia and Oceania region for 32.5 % (2013: 34.1 %) of
business.
Revenues in the Africa, Asia and Oceania region to-
talled € 26,147 million (2013: € 25,916 million), roughly
at the previous year’s level (+ 0.9 %). In China, the
higher
proportion of sales generated by the joint ven-
ture, BMW Brilliance Ltd., Shenyang, resulted in a slight
decrease in revenues reported for this market. By con-
trast, revenues generated in South Korea were up
sig-
nificantly on the back of higher sales volume figures.
External revenue in Germany grew by 10.1 %. In the
Rest of Europe region and in the Americas region, ex-
ternal revenues increased by 9.2 % and 5.3 % respec-
tively.
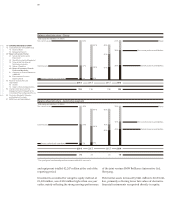
Group cost of sales were 4.3 % higher than in the pre-
vious
year and comprise mainly manufacturing costs
(2014: € 38,253 million; 2013: € 36,578 million), cost of
sales directly attributable to financial services (2014:
€ 14,716 million; 2013: € 14,044 million) and research
and development expenses (2014: € 4,135 million; 2013:
€ 4,118 million). Changes in the average exchange rates
of some currencies as well as inter-segment elimina-
tions worked in the opposite direction.
Gross profit improved by 11.4 % to € 17,005 million, re-
sulting in a gross profit margin of 21.2 % (2013: 20.1 %).
The gross profit margin recorded by the Automotive
segment was 18.6 % (2013: 18.2 %), while that of the
Motorcycles segment was 18.7 % (2013: 16.7 %). In the
Financial Services segment, the gross profit margin
improved from 13.1 % to 13.7 %.
Compared to the previous year, research and develop-
ment expenses increased by € 17 million to € 4,135 mil-
lion. As a percentage of revenues, the research and
development ratio fell by 0.3 percentage points to 5.1 %.
Research and development expenses include
amorti-
sation of capitalised development costs amounting to
€ 1,068 million (2013: € 1,069 million). Total research
and development expenditure amounted to € 4,566 mil-
lion (2013: € 4,793 million). This figure comprises
re-
search costs, non-capitalised development costs and
capitalised development costs (excluding scheduled
amortisation). The research and development expend-
iture ratio was therefore 5.7 % (2013: 6.3 %). The pro-
portion of development costs recognised as assets was
32.8 % (2013: 36.4 %).
Compared to the previous year, selling and administra-
tive expenses increased by € 635 million to € 7,892 mil-
lion. Overall, selling and administrative expenses were
equivalent to 9.8 % (2013: 9.5 %) of revenues.
Adminis-
trative expenses increased due to a number of factors,
including the higher workforce size and higher expenses
for centralised IT activities and new IT projects. Depre-
ciation and amortisation on property, plant and equip-
ment and intangible assets recorded in cost of sales and
in selling and administrative expenses amounted to
€ 4,170 million (2013: € 3,741 million).
Other operating income and expenses improved from
a net expense of € 33 million to a net income of € 5 mil-
lion. The improvement was mainly attributable to gains
on the sale of assets, including those arising on the
deconsolidation of Noord Lease B.V., Groningen, and
the sale of marketable securities.
The profit before financial result (EBIT) came in at
€ 9,118 million (2013: € 7,978 million).
The financial result for the twelve-month period was a
net negative amount of € 411 million, a deterioration
of € 326 million compared to the previous year. The net
expense for other financial result increased by € 541
mil-
lion to € 747 million, mostly reflecting the negative
impact of currency and commodity derivatives.
Impair-
ment losses recognised on other investments, most
notably on the investment in SGL Carbon SE, Wiesbaden,
also contributed to the deterioration in other financial
result. By contrast, the result from equity accounted in-
vestments – which includes the Group’s share of the
results of the joint ventures BMW Brilliance Automotive
Ltd., Shenyang, DriveNow GmbH & Co. KG, Munich,
and DriveNow Verwaltungs GmbH, Munich – improved
by € 248 million.
Profit before tax increased to € 8,707 million (2013:
€ 7,893 million). The pre-tax return on sales was 10.8 %
(2013: 10.4 %).
Income tax expense amounted to € 2,890 million (2013:
€ 2,564 million), resulting in an effective tax rate of
33.2 % (2013: 32.5 %). The changed regional earnings