BMW 2014 Annual Report Download - page 21
Download and view the complete annual report
Please find page 21 of the 2014 BMW annual report below. You can navigate through the pages in the report by either clicking on the pages listed below, or by using the keyword search tool below to find specific information within the annual report.-
 1
1 -
2
-
3
-
4
-
5
-
6
-
7
-
8
-
9
-
10
-
 11
11 -
 12
12 -
 13
13 -
 14
14 -
 15
15 -
 16
16 -
 17
17 -
 18
18 -
 19
19 -
 20
20 -
 21
21 -
 22
22 -
 23
23 -
 24
24 -
 25
25 -
 26
26 -
 27
27 -
 28
28 -
 29
29 -
 30
30 -
 31
31 -
32
-
33
-
34
-
35
-
36
-
37
-
38
-
39
-
40
-
41
-
42
-
43
-
44
-
45
-
46
-
47
-
48
-
49
-
50
-
51
-
52
-
53
-
54
-
55
-
56
-
57
-
58
-
59
-
60
-
61
-
62
-
63
-
64
-
65
-
66
-
67
-
68
-
69
-
70
-
71
-
72
-
73
-
74
-
75
-
76
-
77
-
78
-
79
-
80
-
81
-
82
-
83
-
84
-
85
-
86
-
87
-
88
-
89
-
90
-
91
-
92
-
93
-
94
-
95
-
96
-
97
-
98
-
99
-
100
-
101
-
102
-
103
-
104
-
105
-
106
-
107
-
108
-
109
-
110
-
111
-
112
-
113
-
114
-
115
-
116
-
117
-
118
-
119
-
120
-
121
-
122
-
123
-
124
-
125
-
126
-
127
-
128
-
129
-
130
-
131
-
132
-
133
-
134
-
135
-
136
-
137
-
138
-
139
-
140
-
141
-
142
-
143
-
144
-
145
-
146
-
147
-
148
-
149
-
150
-
151
-
152
-
153
-
154
-
155
-
156
-
157
-
158
-
159
-
160
-
161
-
162
-
163
-
164
-
165
-
166
-
167
-
168
-
169
-
170
-
171
-
172
-
173
-
174
-
175
-
176
-
177
-
178
-
179
-
180
-
181
-
182
-
183
-
184
-
185
-
186
-
187
-
188
-
189
-
190
-
191
-
192
-
193
-
194
-
195
-
196
-
197
-
198
-
199
-
200
-
201
-
202
-
203
-
204
-
205
-
206
-
207
-
208
-
209
-
210
-
211
-
212
 |
 |

21 COMBINED MANAGEMENT REPORT
Capital employed corresponds to the sum of all current
and non-current operational assets, less liabilities that
do not incur interest (e. g. trade payables).
Due to the key importance of the Automotive segment
for the Group as a whole, consideration is also given to
additional key value drivers which have a significant
impact on RoCE and hence on segment performance.
The most important of these additional value drivers are
deliveries to customers, segment revenues and – as the
key performance indicator for profitability – the operat-
ing return on sales (i.e. EBIT margin). Average carbon
emissions for the fleet are also taken into account, re-
flecting their potential impact on earnings in the short
term in the form of ongoing development expenses –
and in the long term due to regulatory requirements.
For these purposes “carbon emissions for the fleet” cor-
responds to average emissions of CO2 for new car sales
in the EU-28 countries.
The use of additional key value drivers makes it easier
to identify the reasons for changes in the RoCE and
to define measures capable of influencing its develop-
ment.
Motorcycles segment
As with the Automotive segment, operating perfor-
mance
for the Motorcycles segment is managed on the
basis of RoCE. Capital employed is measured using
the same procedures as in the Automotive segment.
The strategic target for the Motorcycles segment’s
RoCE is 26 %.
Profit before financial result
RoCE Motorcycles
= Capital employed
The number of vehicles delivered to customers is also
taken into account as a non-financial value driver.
Financial Services segment
As is common practice in the banking sector, the per-
formance of the Financial Services segment is measured
on the basis of return on equity (RoE). RoE for the
Financial
Services segment is defined as segment profit
before taxes, divided by the average amount of equity
capital attributable to the segment. The target is a sus-
tainable
return on equity of at least 18 %.
RoE Financial
Profit before tax
Services =
Equity capital
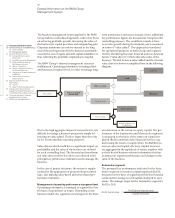
Strategic management at Group level
Strategic management of the Group is performed pri-
marily
at Group level, including quantification of the
financial impact of strategic issues on long-term fore-
casting. The most significant performance indicators at
Group level are Group profit before tax and the size
of the Group’s workforce at the year end. Group profit
before tax is a good overall measure of the Group’s per-
formance after consolidation procedures, and provides
a transparent basis for comparing performance, par-
ticularly over time. The size of the Group’s workforce is
monitored as an additional key non-financial perfor-
mance indicator.
The two key performance indicators – Group profit be-
fore tax and size of the workforce – are supplemented
by a measurement of value added. This highly aggregated
performance indicator provides an insight into capital
efficiency and the (opportunity) cost of capital required
to generate Group profit. Value added corresponds to
the amount of earnings over and above the cost of
capital and gives an indication of whether the Group is
meeting the minimum requirements for the rate of
return expected by capital providers. A positive value
added means that a company is creating more additional
value than the cost of capital.
Value added Group = earnings amount – cost of capital
= earnings amount – (cost of capital rate ×
capital employed)
Capital employed comprises the average amount of
Group equity employed during the year as a whole, the
financial liabilities of the Automotive and Motorcycles
segments and pension provisions. “Earnings amount”
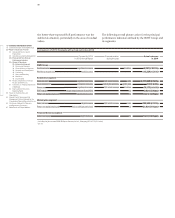
in € million Earnings amount* Cost of capital* (EC + DC) Value added Group*
2014 2013 2014 2013 2014 2013
BMW Group 9,051 8,300 5,212 4,661 3,839 3,639
* Prior year figures have been adjusted in accordance with IAS 8, see note 9.