BMW 2014 Annual Report Download - page 4
Download and view the complete annual report
Please find page 4 of the 2014 BMW annual report below. You can navigate through the pages in the report by either clicking on the pages listed below, or by using the keyword search tool below to find specific information within the annual report.-
 1
1 -
 2
2 -
 3
3 -
 4
4 -
 5
5 -
 6
6 -
 7
7 -
 8
8 -
 9
9 -
 10
10 -
 11
11 -
 12
12 -
 13
13 -
 14
14 -
 15
15 -
16
-
17
-
18
-
19
-
20
-
21
-
22
-
23
-
24
-
25
-
26
-
27
-
28
-
29
-
30
-
31
-
32
-
33
-
34
-
35
-
36
-
37
-
38
-
39
-
40
-
41
-
42
-
43
-
44
-
45
-
46
-
47
-
48
-
49
-
50
-
51
-
52
-
53
-
54
-
55
-
56
-
57
-
58
-
59
-
60
-
61
-
62
-
63
-
64
-
65
-
66
-
67
-
68
-
69
-
70
-
71
-
72
-
73
-
74
-
75
-
76
-
77
-
78
-
79
-
80
-
81
-
82
-
83
-
84
-
85
-
86
-
87
-
88
-
89
-
90
-
91
-
92
-
93
-
94
-
95
-
96
-
97
-
98
-
99
-
100
-
101
-
102
-
103
-
104
-
105
-
106
-
107
-
108
-
109
-
110
-
111
-
112
-
113
-
114
-
115
-
116
-
117
-
118
-
119
-
120
-
121
-
122
-
123
-
124
-
125
-
126
-
127
-
128
-
129
-
130
-
131
-
132
-
133
-
134
-
135
-
136
-
137
-
138
-
139
-
140
-
141
-
142
-
143
-
144
-
145
-
146
-
147
-
148
-
149
-
150
-
151
-
152
-
153
-
154
-
155
-
156
-
157
-
158
-
159
-
160
-
161
-
162
-
163
-
164
-
165
-
166
-
167
-
168
-
169
-
170
-
171
-
172
-
173
-
174
-
175
-
176
-
177
-
178
-
179
-
180
-
181
-
182
-
183
-
184
-
185
-
186
-
187
-
188
-
189
-
190
-
191
-
192
-
193
-
194
-
195
-
196
-
197
-
198
-
199
-
200
-
201
-
202
-
203
-
204
-
205
-
206
-
207
-
208
-
209
-
210
-
211
-
212
 |
 |

4
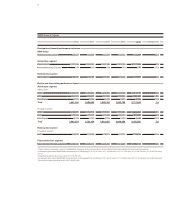
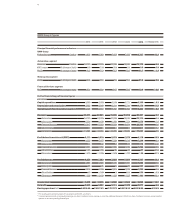
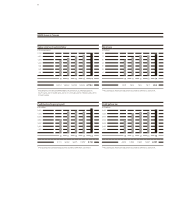
BMW Group in figures
2010 2011 2012 2013 2014 Change in %
Principal financial performance indicators
BMW Group
Profit before tax € million 4,853 7,383 7,803 7,8931 8,707 10.3
Automotive segment
Revenues € million 54,137 63,229 70,208 70,6301 75,173 6.4
EBIT margin
% (change in %pts)
8.0 11.8 10.8 9.4 9.6 0.2
RoCE
% (change in %pts)
40.2 77.3 73.7 63.01 61.7 – 1.3
Motorcycles segment
RoCE
% (change in %pts)
18.0 10.2 1.8 16.4 21.8 5.4
Financial Services segment
RoE
% (change in %pts)
26.1 29.4 21.2 20.01 19.4 – 0.6
Further financial key performance figures
in € million
Capital expenditure 3,263 3,692 5,240 6,7111 6,100 – 9.1
Depreciation and amortisation 3,682 3,646 3,541 3,7411 4,170 11.5
Operating cash flow Automotive segment 8,149 8,110 9,167 9,9641 9,423 – 5.4
Revenues 60,477 68,821 76,848 76,0591 80,401 5.7
Automotive 54,137 63,229 70,208 70,6301 75,173 6.4
Motorcycles 1,304 1,436 1,490 1,504 1,679 11.6
Financial Services 16,617 17,510 19,550 19,874 20,599 3.6
Other Entities 4 5 5 6 7 16.7
Eliminations – 11,585 – 13,359 – 14,405 – 15,955 – 17,057 6.9
Profit before financial result (EBIT) 5,111 8,018 8,275 7,9781 9,118 14.3
Automotive 4,355 7,477 7,599 6,6491 7,244 8.9
Motorcycles 71 45 9 79 112 41.8
Financial Services 1,201 1,763 1,558 1,643 1,756 6.9
Other Entities – 41 – 19 58 44 71 61.4
Eliminations – 475 – 1,248 – 949 – 4371 – 65 85.1
Profit before tax 4,853 7,383 7,803 7,8931 8,707 10.3
Automotive 3,887 6,823 7,170 6,561 6,886 5.0
Motorcycles 65 41 6 76 107 40.8
Financial Services 1,214 1,790 1,561 1,6191 1,723 6.4
Other Entities 45 – 168 3 164 154 – 6.1
Eliminations – 358 – 1,103 – 937 – 527 – 163 69.1
Income taxes – 1,610 – 2,476 – 2,692 – 2,5641 – 2,890 – 12.7
Net profit 3,243 4,907 5,111 5,3291 5,817 9.2
Earnings per share2 in € 4.93 / 4.95 7.45 / 7.47 7.75 / 7.77 8.081/ 8.101 8.83 / 8.85 9.3 / 9.3
1 Prior year figures have been adjusted in accordance with IAS 8, see note 9.
2 Common / preferred stock. In computing earnings per share of preferred stock, earnings to cover the additional dividend of € 0.02 per share of preferred stock are spread over the
quarters of the corresponding financial year.