BMW 2014 Annual Report Download - page 129
Download and view the complete annual report
Please find page 129 of the 2014 BMW annual report below. You can navigate through the pages in the report by either clicking on the pages listed below, or by using the keyword search tool below to find specific information within the annual report.-
 1
1 -
2
-
3
-
4
-
5
-
6
-
7
-
8
-
9
-
10
-
11
-
12
-
13
-
14
-
15
-
16
-
17
-
18
-
19
-
20
-
21
-
22
-
23
-
24
-
25
-
26
-
27
-
28
-
29
-
30
-
31
-
32
-
33
-
34
-
35
-
36
-
37
-
38
-
39
-
40
-
41
-
42
-
43
-
44
-
45
-
46
-
47
-
48
-
49
-
50
-
51
-
52
-
53
-
54
-
55
-
56
-
57
-
58
-
59
-
60
-
61
-
62
-
63
-
64
-
65
-
66
-
67
-
68
-
69
-
70
-
71
-
72
-
73
-
74
-
75
-
76
-
77
-
78
-
79
-
80
-
81
-
82
-
83
-
84
-
85
-
86
-
87
-
88
-
89
-
90
-
91
-
92
-
93
-
94
-
95
-
96
-
97
-
98
-
99
-
100
-
101
-
102
-
103
-
104
-
105
-
106
-
107
-
108
-
109
-
110
-
111
-
112
-
113
-
114
-
115
-
116
-
117
-
118
-
 119
119 -
 120
120 -
 121
121 -
 122
122 -
 123
123 -
 124
124 -
 125
125 -
 126
126 -
 127
127 -
 128
128 -
 129
129 -
 130
130 -
 131
131 -
 132
132 -
 133
133 -
 134
134 -
 135
135 -
 136
136 -
 137
137 -
 138
138 -
 139
139 -
140
-
141
-
142
-
143
-
144
-
145
-
146
-
147
-
148
-
149
-
150
-
151
-
152
-
153
-
154
-
155
-
156
-
157
-
158
-
159
-
160
-
161
-
162
-
163
-
164
-
165
-
166
-
167
-
168
-
169
-
170
-
171
-
172
-
173
-
174
-
175
-
176
-
177
-
178
-
179
-
180
-
181
-
182
-
183
-
184
-
185
-
186
-
187
-
188
-
189
-
190
-
191
-
192
-
193
-
194
-
195
-
196
-
197
-
198
-
199
-
200
-
201
-
202
-
203
-
204
-
205
-
206
-
207
-
208
-
209
-
210
-
211
-
212
 |
 |

129 GROUP FINANCIAL STATEMENTS
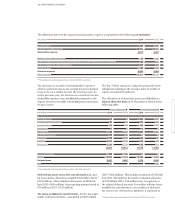
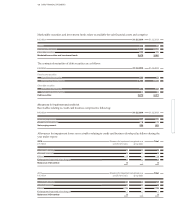
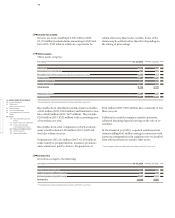
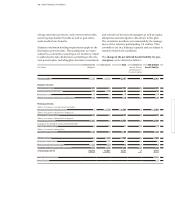
in € million 31. 12. 2014 31. 12. 2013
Gross investment in finance leases
due within one year 5,366 4,816
due between one and five years 11,231 9,748
due later than five years 109 98
16,706 14,662
Present value of future minimum lease payments
due within one year 4,898 4,378
due between one and five years 10,175 8,813
due later than five years 102 85
15,175 13,276
Unrealised interest income 1,531 1,386
28
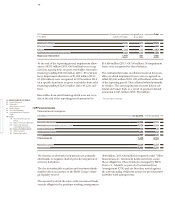
Receivables from sales financing
Receivables from sales financing, totalling € 61,024 mil-
lion (2013: € 54,117 million), comprise € 45,849 million
(2013: € 40,841 million) for credit financing for retail
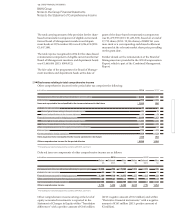
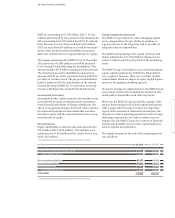
Allowances on receivables from sales financing – which only arise within the Financial Services segment – developed
as follows:
customers and dealers and € 15,175 million (2013:
€ 13,276 million) for finance leases. Finance leases are
analysed as follows:
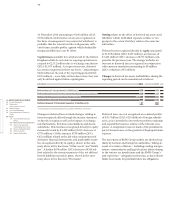
in € million 31. 12. 2014 31. 12. 2013
Gross carrying amount 62,539 55,697
Allowance for impairment – 1,515 – 1,580
Net carrying amount 61,024 54,117
2014 Allowance for impairment recognised on a Total
in € million specific item basis group basis
Balance at 1 January* 1,098 482 1,580
Allocated / reversed 239 41 280
Utilised – 371 – 20 – 391
Exchange rate impact and other changes 34 12 46
Balance at 31 December 1,000 515 1,515
* Balance at 1 January adjusted due to deconsolidation of entities.
Contingent rents recognised as income (generally re-
lating
to the distance driven) amounted to € 2 million
(2013: € 3 million). Write-downs on finance leases
amounting to € 183 million (2013: € 159 million) were
measured and recognised on the basis of specific credit
risks. Non-guaranteed residual values that fall to the
benefit of the lessor amounted to € 140 million (2013:
€ 120 million).
Receivables from sales financing include € 37,438 mil-
lion (2013: € 32,616 million) with a remaining term of
more than one year.
Allowances for impairment and credit risk