BMW 2014 Annual Report Download - page 143
Download and view the complete annual report
Please find page 143 of the 2014 BMW annual report below. You can navigate through the pages in the report by either clicking on the pages listed below, or by using the keyword search tool below to find specific information within the annual report.-
 1
1 -
2
-
3
-
4
-
5
-
6
-
7
-
8
-
9
-
10
-
11
-
12
-
13
-
14
-
15
-
16
-
17
-
18
-
19
-
20
-
21
-
22
-
23
-
24
-
25
-
26
-
27
-
28
-
29
-
30
-
31
-
32
-
33
-
34
-
35
-
36
-
37
-
38
-
39
-
40
-
41
-
42
-
43
-
44
-
45
-
46
-
47
-
48
-
49
-
50
-
51
-
52
-
53
-
54
-
55
-
56
-
57
-
58
-
59
-
60
-
61
-
62
-
63
-
64
-
65
-
66
-
67
-
68
-
69
-
70
-
71
-
72
-
73
-
74
-
75
-
76
-
77
-
78
-
79
-
80
-
81
-
82
-
83
-
84
-
85
-
86
-
87
-
88
-
89
-
90
-
91
-
92
-
93
-
94
-
95
-
96
-
97
-
98
-
99
-
100
-
101
-
102
-
103
-
104
-
105
-
106
-
107
-
108
-
109
-
110
-
111
-
112
-
113
-
114
-
115
-
116
-
117
-
118
-
119
-
120
-
121
-
122
-
123
-
124
-
125
-
126
-
127
-
128
-
129
-
130
-
131
-
132
-
 133
133 -
 134
134 -
 135
135 -
 136
136 -
 137
137 -
 138
138 -
 139
139 -
 140
140 -
 141
141 -
 142
142 -
 143
143 -
 144
144 -
 145
145 -
 146
146 -
 147
147 -
 148
148 -
 149
149 -
 150
150 -
 151
151 -
 152
152 -
 153
153 -
154
-
155
-
156
-
157
-
158
-
159
-
160
-
161
-
162
-
163
-
164
-
165
-
166
-
167
-
168
-
169
-
170
-
171
-
172
-
173
-
174
-
175
-
176
-
177
-
178
-
179
-
180
-
181
-
182
-
183
-
184
-
185
-
186
-
187
-
188
-
189
-
190
-
191
-
192
-
193
-
194
-
195
-
196
-
197
-
198
-
199
-
200
-
201
-
202
-
203
-
204
-
205
-
206
-
207
-
208
-
209
-
210
-
211
-
212
 |
 |

143 GROUP FINANCIAL STATEMENTS
at the end of the reporting period, if the other assump-
tions used in the calculation were kept constant. The
defined benefit obligation amounted to € 20,462 million
at 31 December 2014.
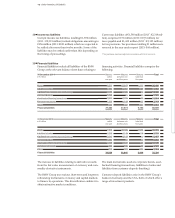
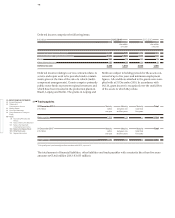
The weighted duration of all pension obligations in
Germany, the UK and other countries (based on present
values of the defined benefit obligation) developed as
follows:
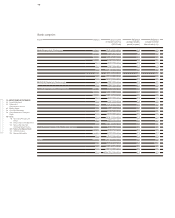
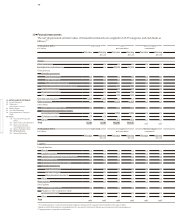
The sensitivity analysis provided below shows the ex-
tent
to which – based on an appropriate review – the
defined benefit obligation would have been affected by
changes in the relevant assumptions that were possible
In the UK, the sensitivity analysis for the pension level
trend also takes account of restrictions due to caps and
floors.
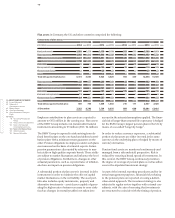
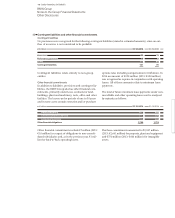
payments and the expected pattern of pension obliga-
tions. In their own way, each of these measures helps to
reduce fluctuations in pension funding shortfalls.
Most of the BMW Group’s pension assets are adminis-
tered separately and kept legally segregated from com-
pany assets using trust fund arrangements. As a conse-
quence, the level of funds required to finance pension
payments out of operations will be substantially
re-
duced in the future, since most of the Group’s pension
obligations are settled out of the assets of pension
funds / trust fund arrangements.
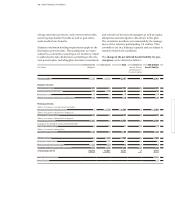
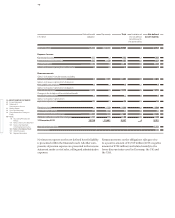
The defined benefit obligation relates to current
em-
ployees, former employees with vested benefits and
pensioners as follows:
31 December Germany United Kingdom Other
in € million 2014 2013 2014 2013 2014 2013
Current employees 6,495 4,715 2,295 1,604 1,003 723
Pensioners 2,650 2,297 4,208 3,651 212 141
Former employees with vested benefits 491 388 2,996 2,154 112 85
Defined benefit obligation 9,636 7,400 9,499 7,409 1,327 949
31 December Germany United Kingdom Other
in years 2014 2013 2014 2013 2014 2013
Weighted duration of all pension obligations 21.4 19.6 19.9 18.3 19.2 14.9
31 December Change in defined benefit obligation
2014 2013
in € million in % in € million in %
Discount rate increase of 0.75 % – 2,888 – 14.1 – 2,028 – 12.9
decrease of 0.75 % 3,675 18.0 2,528 16.0
Pension level trend increase of 0.25 % 727 3.6 506 3.2
decrease of 0.25 % – 679 – 3.3 – 479 – 3.0
Average life expectancy increase of 1 year 703 3.4 510 3.2
decrease of 1 year – 700 – 3.4 – 514 – 3.3
Pension entitlement trend increase of 0.25 % 152 0.7 101 0.6
decrease of 0.25 % – 146 – 0.7 – 97 – 0.6