BMW 2014 Annual Report Download - page 119
Download and view the complete annual report
Please find page 119 of the 2014 BMW annual report below. You can navigate through the pages in the report by either clicking on the pages listed below, or by using the keyword search tool below to find specific information within the annual report.-
 1
1 -
2
-
3
-
4
-
5
-
6
-
7
-
8
-
9
-
10
-
11
-
12
-
13
-
14
-
15
-
16
-
17
-
18
-
19
-
20
-
21
-
22
-
23
-
24
-
25
-
26
-
27
-
28
-
29
-
30
-
31
-
32
-
33
-
34
-
35
-
36
-
37
-
38
-
39
-
40
-
41
-
42
-
43
-
44
-
45
-
46
-
47
-
48
-
49
-
50
-
51
-
52
-
53
-
54
-
55
-
56
-
57
-
58
-
59
-
60
-
61
-
62
-
63
-
64
-
65
-
66
-
67
-
68
-
69
-
70
-
71
-
72
-
73
-
74
-
75
-
76
-
77
-
78
-
79
-
80
-
81
-
82
-
83
-
84
-
85
-
86
-
87
-
88
-
89
-
90
-
91
-
92
-
93
-
94
-
95
-
96
-
97
-
98
-
99
-
100
-
101
-
102
-
103
-
104
-
105
-
106
-
107
-
108
-
 109
109 -
 110
110 -
 111
111 -
 112
112 -
 113
113 -
 114
114 -
 115
115 -
 116
116 -
 117
117 -
 118
118 -
 119
119 -
 120
120 -
 121
121 -
 122
122 -
 123
123 -
 124
124 -
 125
125 -
 126
126 -
 127
127 -
 128
128 -
 129
129 -
130
-
131
-
132
-
133
-
134
-
135
-
136
-
137
-
138
-
139
-
140
-
141
-
142
-
143
-
144
-
145
-
146
-
147
-
148
-
149
-
150
-
151
-
152
-
153
-
154
-
155
-
156
-
157
-
158
-
159
-
160
-
161
-
162
-
163
-
164
-
165
-
166
-
167
-
168
-
169
-
170
-
171
-
172
-
173
-
174
-
175
-
176
-
177
-
178
-
179
-
180
-
181
-
182
-
183
-
184
-
185
-
186
-
187
-
188
-
189
-
190
-
191
-
192
-
193
-
194
-
195
-
196
-
197
-
198
-
199
-
200
-
201
-
202
-
203
-
204
-
205
-
206
-
207
-
208
-
209
-
210
-
211
-
212
 |
 |

119 GROUP FINANCIAL STATEMENTS
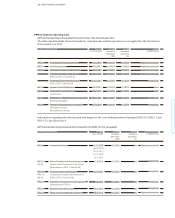
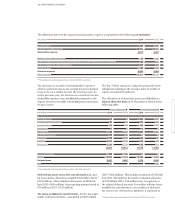
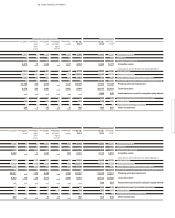
The difference between the expected and actual tax expense is explained in the following reconciliation:
Tax increases as a result of non-deductible expenses
and tax reductions due to tax-exempt income remained
more or less at
a similar level to the previous year. As
in the previous
year, tax increases as a result of non-tax-
deductible expenses were attributable primarily to the
impact of non-recoverable withholding taxes and trans-
fer price issues.
Deferred tax assets on tax loss carryforwards and capi-
tal losses before allowances totalled € 566 million (
2013*
:
€ 512 million). After valuation allowances of € 496 mil-
lion (
2013
: € 409 million), their carrying amount stood at
€ 70 million (
2013*
: € 103 million).
Tax losses available for carryforward – for the most part
usable without restriction – amounted to € 469 million
The line “Other variances” comprises primarily recon-
ciling items relating to the Group’s share of results of
equity accounted investments.
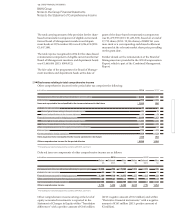
The allocation of deferred tax assets and liabilities to
balance sheet line items at 31 December is shown in the
following table:
(2013*: € 402 million). This includes an amount of € 228 mil-
lion (2013: € 42 million), for which a valuation allowance
of € 74 million (2013: € 14 million) was recognised on
the related deferred tax asset. For entities with tax losses
available for carryforward, a net surplus of deferred
tax assets over deferred tax liabilities is reported at
Deferred tax assets Deferred tax liabilities
in € million 2014 2013* 2014 2013*
Intangible assets 11 9 1,706 1,571
Property, plant and equipment 50 26 400 264
Leased products 393 436 5,486 4,498
Investments 5 6 12 5
Other assets 1,289 1,078 2,687 3,747
Tax loss carryforwards 566 512 – –
Provisions 4,175 3,220 95 47
Liabilities 2,827 2,955 602 449
Eliminations 2,945 2,570 690 661
12,261 10,812 11,678 11,242
Valuation allowance – 496 – 409 – –
Netting – 9,704 – 8,783 – 9,704 – 8,783
Deferred taxes 2,061 1,620 1,974 2,459
Net 87 839
* Prior year figures have been adjusted in accordance with IAS 8, see note 9.
in € million 2014 2013*
Profit before tax 8,707 7,893
Tax rate applicable in Germany 30.7 % 30.5 %
Expected tax expense 2,673 2,407
Variances due to different tax rates – 55 – 134
Tax increases (+) / tax reductions (–) as a result of non-deductible expenses and tax-exempt income 150 164
Tax expense (+) / benefits (–) for prior years 275 222
Other variances – 153 – 95
Actual tax expense 2,890 2,564
Effective tax rate 33.2 % 32.5 %
* Prior year figures have been adjusted in accordance with IAS 8, see note 9.
* Prior year figures have been adjusted in accordance with IAS 8, see note 9.