BMW 2014 Annual Report Download - page 200
Download and view the complete annual report
Please find page 200 of the 2014 BMW annual report below. You can navigate through the pages in the report by either clicking on the pages listed below, or by using the keyword search tool below to find specific information within the annual report.-
 1
1 -
2
-
3
-
4
-
5
-
6
-
7
-
8
-
9
-
10
-
11
-
12
-
13
-
14
-
15
-
16
-
17
-
18
-
19
-
20
-
21
-
22
-
23
-
24
-
25
-
26
-
27
-
28
-
29
-
30
-
31
-
32
-
33
-
34
-
35
-
36
-
37
-
38
-
39
-
40
-
41
-
42
-
43
-
44
-
45
-
46
-
47
-
48
-
49
-
50
-
51
-
52
-
53
-
54
-
55
-
56
-
57
-
58
-
59
-
60
-
61
-
62
-
63
-
64
-
65
-
66
-
67
-
68
-
69
-
70
-
71
-
72
-
73
-
74
-
75
-
76
-
77
-
78
-
79
-
80
-
81
-
82
-
83
-
84
-
85
-
86
-
87
-
88
-
89
-
90
-
91
-
92
-
93
-
94
-
95
-
96
-
97
-
98
-
99
-
100
-
101
-
102
-
103
-
104
-
105
-
106
-
107
-
108
-
109
-
110
-
111
-
112
-
113
-
114
-
115
-
116
-
117
-
118
-
119
-
120
-
121
-
122
-
123
-
124
-
125
-
126
-
127
-
128
-
129
-
130
-
131
-
132
-
133
-
134
-
135
-
136
-
137
-
138
-
139
-
140
-
141
-
142
-
143
-
144
-
145
-
146
-
147
-
148
-
149
-
150
-
151
-
152
-
153
-
154
-
155
-
156
-
157
-
158
-
159
-
160
-
161
-
162
-
163
-
164
-
165
-
166
-
167
-
168
-
169
-
170
-
171
-
172
-
173
-
174
-
175
-
176
-
177
-
178
-
179
-
180
-
181
-
182
-
183
-
184
-
185
-
186
-
187
-
188
-
189
-
 190
190 -
 191
191 -
 192
192 -
 193
193 -
 194
194 -
 195
195 -
 196
196 -
 197
197 -
 198
198 -
 199
199 -
 200
200 -
 201
201 -
 202
202 -
 203
203 -
 204
204 -
 205
205 -
 206
206 -
 207
207 -
 208
208 -
 209
209 -
 210
210 -
211
-
212
 |
 |

200
200 OTHER INFORMATION
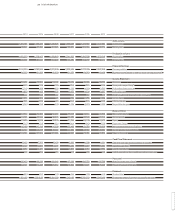
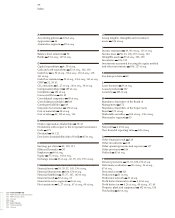
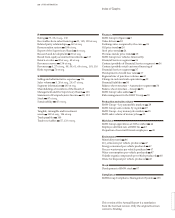
200 BMW Group Ten-year Comparison
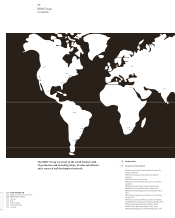
202 BMW Group Locations
204 Glossary
206 Index
207 Index of Graphs
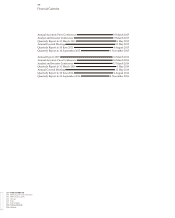
208 Financial Calendar
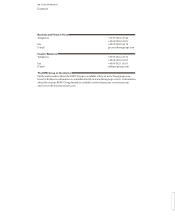
209 Contacts
2014 2013 2012 2011
Sales volume
Automobiles units 2,117,965 1,963,798 1,845,186 1,668,982
Motorcycles1 units 123,495 115,215 106,358 104,286
Production volume
Automobiles units 2,165,566 2,006,366 1,861,826 1,738,160
Motorcycles1 units 133,615 110,127 113,811 110,360
Financial Services
Contract portfolio contracts 4,359,572 4,130,002 3,846,364 3,592,093
Business volume (based on balance sheet carrying amounts)2 € million 96,390 84,347 80,974 75,245
Income Statement
Revenues € million 80,401 76,059 3 76,848 68,821
Gross profit margin Group4 % 21.2 20.1 20.2 21.1
Profit before financial result € million 9,118 7,978 3 8,275 8,018
Profit before tax € million 8,707 7,893 3 7,803 7,383
Return on sales (earnings before tax / revenues) % 10.8 10.4 10.2 10.7
Income taxes € million 2,890 2,5643 2,692 2,476
Effective tax rate % 33.2 32.5 34.5 33.5
Net profit for the year € million 5,817 5,3293 5,111 4,907
Balance Sheet
Non-current assets € million 97,959 86,1933 81,305 74,425
Current assets € million 56,844 52,1843 50,530 49,004
Equity € million 37,437 35,6003 30,606 27,103
Equity ratio Group % 24.2 25.73 23.2 22.0
Non-current provisions and liabilities € million 58,288 51,6433 52,834 49,113
Current provisions and liabilities € million 59,078 51,1343 48,395 47,213
Balance sheet total € million 154,803 138,377 3 131,835 123,429
Cash Flow Statement
Cash and cash equivalents at balance sheet date € million 7,688 7,6713 8,370 7,776
Operating cash flow 5 € million 9,423 9,9643 9,167 8,110
Capital expenditure € million 6,100 6,7113 5,240 3,692
Capital expenditure ratio (capital expenditure / revenues) % 7.6 8.8 6.8 5.4
Personnel
Workforce at the end of year6 116,324 110,351 105,876 100,306
Personnel cost per employee € 92,337 89,8693 89,161 84,887
Dividend
Dividend total € million 1,904 1,707 1,640 1,508
Dividend per share of common stock / preferred stock € 2.90 / 2.92 2.60 / 2.62 2.50 /2.52 2.30 / 2.32
1 Excluding Husqvarna, sales volume up to 2013: 59,776 units; production up to 2013: 59,426 units.
2 Amount computed on the basis of balance sheet figures: until 2007 from the Group balance sheet, from 2008 onwards from the Financial Services segment balance sheet.
3 Prior year figures have been adjusted in accordance with IAS 8, see note 9.
4 Research and development expenses included in cost of sales with the effect from 2008.
5 Figures are reported in the cash flow statement up to 2006 as cash inflow from operating activities of Industrial Operations and from 2007 as cash inflow from
operating activities of the Automotive segment.
6 Figures exclude dormant employment contracts, employees in the non-work phases of pre-retirement part-time arrangements and low wage earners.
OTHER INFORMATION
BMW Group Ten-year Comparison