BMW 2014 Annual Report Download - page 121
Download and view the complete annual report
Please find page 121 of the 2014 BMW annual report below. You can navigate through the pages in the report by either clicking on the pages listed below, or by using the keyword search tool below to find specific information within the annual report.-
 1
1 -
2
-
3
-
4
-
5
-
6
-
7
-
8
-
9
-
10
-
11
-
12
-
13
-
14
-
15
-
16
-
17
-
18
-
19
-
20
-
21
-
22
-
23
-
24
-
25
-
26
-
27
-
28
-
29
-
30
-
31
-
32
-
33
-
34
-
35
-
36
-
37
-
38
-
39
-
40
-
41
-
42
-
43
-
44
-
45
-
46
-
47
-
48
-
49
-
50
-
51
-
52
-
53
-
54
-
55
-
56
-
57
-
58
-
59
-
60
-
61
-
62
-
63
-
64
-
65
-
66
-
67
-
68
-
69
-
70
-
71
-
72
-
73
-
74
-
75
-
76
-
77
-
78
-
79
-
80
-
81
-
82
-
83
-
84
-
85
-
86
-
87
-
88
-
89
-
90
-
91
-
92
-
93
-
94
-
95
-
96
-
97
-
98
-
99
-
100
-
101
-
102
-
103
-
104
-
105
-
106
-
107
-
108
-
109
-
110
-
 111
111 -
 112
112 -
 113
113 -
 114
114 -
 115
115 -
 116
116 -
 117
117 -
 118
118 -
 119
119 -
 120
120 -
 121
121 -
 122
122 -
 123
123 -
 124
124 -
 125
125 -
 126
126 -
 127
127 -
 128
128 -
 129
129 -
 130
130 -
 131
131 -
132
-
133
-
134
-
135
-
136
-
137
-
138
-
139
-
140
-
141
-
142
-
143
-
144
-
145
-
146
-
147
-
148
-
149
-
150
-
151
-
152
-
153
-
154
-
155
-
156
-
157
-
158
-
159
-
160
-
161
-
162
-
163
-
164
-
165
-
166
-
167
-
168
-
169
-
170
-
171
-
172
-
173
-
174
-
175
-
176
-
177
-
178
-
179
-
180
-
181
-
182
-
183
-
184
-
185
-
186
-
187
-
188
-
189
-
190
-
191
-
192
-
193
-
194
-
195
-
196
-
197
-
198
-
199
-
200
-
201
-
202
-
203
-
204
-
205
-
206
-
207
-
208
-
209
-
210
-
211
-
212
 |
 |

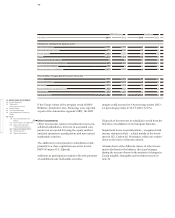
121 GROUP FINANCIAL STATEMENTS
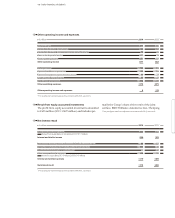
2014 2013*
Net profit for the year after minority interest € million 5,798.1 5,302.8
Profit attributable to common stock € million 5,317.7 4,865.3
Profit attributable to preferred stock € million 480.4 437.5
Average number of common stock shares in circulation number 601,995,196 601,995,196
Average number of preferred stock shares in circulation number 54,259,767 53,993,635
Basic earnings per share of common stock € 8.83 8.08
Basic earnings per share of preferred stock € 8.85 8.10
Dividend per share of common stock € 2.90 2.60
Dividend per share of preferred stock € 2.92 2.62
* Prior year figures have been adjusted in accordance with IAS 8, see note 9.
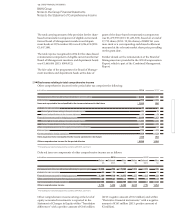
Earnings per share
18
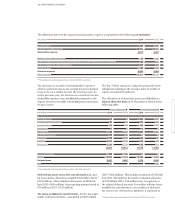
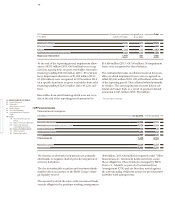
Personnel expenses include € 42 million (2013: € 48
mil-
lion) of expenditure incurred to adjust the workforce size.
The average number of employees during the year
was:
Basic earnings per share of preferred stock are com-
puted on the basis of the number of preferred stock
shares entitled to receive a dividend in each of the rele-
The number of employees at the end of the reporting period is disclosed in the Combined Management Report.
Other disclosures relating to the income statement
Personnel expenses
The income statement includes personnel expenses as follows:
vant financial years. As in the previous year, diluted
earnings per share correspond to basic earnings per
share.
2014 2013*
Employees 105,743 100,057
thereof 186 (2013: 96) at proportionately-consolidated entities
Apprentices and students gaining work experience 7,560 7,165
thereof 2 (2013: 3) at proportionately-consolidated entities
Average number of employees 113,303 107,222
* Prior year figures have been adjusted in accordance with IAS 8, see note 9.
in € million 2014 2013*
Wages and salaries 8,094 7,401
Social security, retirement and welfare costs 1,670 1,591
thereof pension costs: € 991 million (2013: € 958 million)
Personnel expenses 9,764 8,992
* Prior year figures have been adjusted in accordance with IAS 8, see note 9.
19