BMW 2014 Annual Report Download - page 51
Download and view the complete annual report
Please find page 51 of the 2014 BMW annual report below. You can navigate through the pages in the report by either clicking on the pages listed below, or by using the keyword search tool below to find specific information within the annual report.-
 1
1 -
2
-
3
-
4
-
5
-
6
-
7
-
8
-
9
-
10
-
11
-
12
-
13
-
14
-
15
-
16
-
17
-
18
-
19
-
20
-
21
-
22
-
23
-
24
-
25
-
26
-
27
-
28
-
29
-
30
-
31
-
32
-
33
-
34
-
35
-
36
-
37
-
38
-
39
-
40
-
 41
41 -
 42
42 -
 43
43 -
 44
44 -
 45
45 -
 46
46 -
 47
47 -
 48
48 -
 49
49 -
 50
50 -
 51
51 -
 52
52 -
 53
53 -
 54
54 -
 55
55 -
 56
56 -
 57
57 -
 58
58 -
 59
59 -
 60
60 -
 61
61 -
62
-
63
-
64
-
65
-
66
-
67
-
68
-
69
-
70
-
71
-
72
-
73
-
74
-
75
-
76
-
77
-
78
-
79
-
80
-
81
-
82
-
83
-
84
-
85
-
86
-
87
-
88
-
89
-
90
-
91
-
92
-
93
-
94
-
95
-
96
-
97
-
98
-
99
-
100
-
101
-
102
-
103
-
104
-
105
-
106
-
107
-
108
-
109
-
110
-
111
-
112
-
113
-
114
-
115
-
116
-
117
-
118
-
119
-
120
-
121
-
122
-
123
-
124
-
125
-
126
-
127
-
128
-
129
-
130
-
131
-
132
-
133
-
134
-
135
-
136
-
137
-
138
-
139
-
140
-
141
-
142
-
143
-
144
-
145
-
146
-
147
-
148
-
149
-
150
-
151
-
152
-
153
-
154
-
155
-
156
-
157
-
158
-
159
-
160
-
161
-
162
-
163
-
164
-
165
-
166
-
167
-
168
-
169
-
170
-
171
-
172
-
173
-
174
-
175
-
176
-
177
-
178
-
179
-
180
-
181
-
182
-
183
-
184
-
185
-
186
-
187
-
188
-
189
-
190
-
191
-
192
-
193
-
194
-
195
-
196
-
197
-
198
-
199
-
200
-
201
-
202
-
203
-
204
-
205
-
206
-
207
-
208
-
209
-
210
-
211
-
212
 |
 |

51 COMBINED MANAGEMENT REPORT
mix as well as intergroup pricing issues contributed to
the increase in the income tax expense for the year.
Earnings performance by segment
Revenues of the Automotive segment grew by 6.4 % to
€ 75,173 million on the back of higher sales volume.
Adjusted for exchange rate factors, segment revenues
rose by 7.5 %. The gross profit margin improved year-
on-year from 18.2 % to 18.6 %.
Compared to the previous year, selling and administra-
tive expenses increased by € 531 million to € 6,645 mil-
lion. Administrative expenses increased due to a num-
ber of factors, including the higher workforce size and
higher expenses for centralised IT activities and new
IT
projects. Overall, selling and administrative expenses
were equivalent to 8.8 % (2013: 8.7 %) of revenues.
The net expense from other operating income and ex-
penses
improved by € 26 million (2013: net expense of
€ 89 million), mainly reflecting gains on the sale of mar-
ketable securities.
The profit before financial result (EBIT) amounted to
€ 7,244 million (2013: € 6,649 million), giving an EBIT
margin of 9.6 % (2013: 9.4 %).
The financial result of the Automotive segment was a
net negative amount of € 358 million, a deterioration
of € 270 million compared to the previous year. Other
financial result was adversely affected by currency
and commodity derivatives and fell to a net negative
amount of € 724 million. This figure also includes im-
pairment losses recognised on other investments,
most notably on the investment in SGL Carbon SE,
Wiesbaden. By contrast, the result from equity ac-
counted investments – which includes the segment’s
share of the results of BMW Brilliance Automotive
Ltd., Shenyang, and the two DriveNow entities – im-
proved by € 248 million.
Overall, profit before tax amounted to € 6,886 million
(2013: € 6,561 million), resulting in an effective tax rate
of 34.3 % (2013: 32.8 %).
Revenues of the Motorcycles segment climbed by 11.6 %
compared to the previous year (by 14.0 % adjusted for
exchange rate factors).
Segment profit before tax improved by € 31 million to
€ 107 million.
Financial Services segment revenues grew by 3.6 % to
€ 20,599 million (by 3.8 % adjusted for exchange rate
factors). The segment’s performance reflects the growth
in the contract portfolio. The gross profit margin im-
proved year-on-year to 13.7 % (2013: 13.1 %). Selling and
administrative expenses were € 82 million higher at
€ 1,035 million. The net negative amount from other oper-
ating
income and expenses deteriorated by € 17 million.
Overall the Financial Services segment reports profit
before tax of € 1,723 million, 6.4 % up on the previous
year (2013: € 1,619 million).
Profit before tax in the Other Entities segment, at
€ 154 million, was € 10 million lower than one year
earlier.
The negative impact on earnings at the level of profit
before tax reported in the Eliminations column
de-
creased from € 527 million in 2013 to € 163 million in
2014, partly reflecting product mix improvements
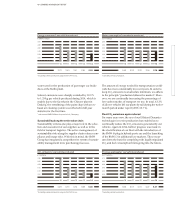
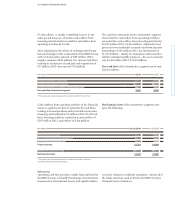
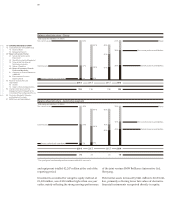
Revenues by segment
in € million
2014 2013*
Automotive 75,173 70,630
Motorcycles 1,679 1,504
Financial Services 20,599 19,874
Other Entities 7 6
Eliminations – 17,057 – 15,955
Group 80,401 76,059
* Prior year figures have been adjusted in accordance with IAS 8, see note 9.
Profit / loss before tax by segment
in € million
2014 2013*
Automotive 6,886 6,561
Motorcycles 107 76
Financial Services 1,723 1,619
Other Entities 154 164
Eliminations – 163 – 527
Group 8,707 7,893
* Prior year figures have been adjusted in accordance with IAS 8, see note 9.