Asus 2009 Annual Report Download - page 98
Download and view the complete annual report
Please find page 98 of the 2009 Asus annual report below. You can navigate through the pages in the report by either clicking on the pages listed below, or by using the keyword search tool below to find specific information within the annual report.-
 1
1 -
2
-
3
-
4
-
5
-
6
-
7
-
8
-
9
-
10
-
11
-
12
-
13
-
14
-
15
-
16
-
17
-
18
-
19
-
20
-
21
-
22
-
23
-
24
-
25
-
26
-
27
-
28
-
29
-
30
-
31
-
32
-
33
-
34
-
35
-
36
-
37
-
38
-
39
-
40
-
41
-
42
-
43
-
44
-
45
-
46
-
47
-
48
-
49
-
50
-
51
-
52
-
53
-
54
-
55
-
56
-
57
-
58
-
59
-
60
-
61
-
62
-
63
-
64
-
65
-
66
-
67
-
68
-
69
-
70
-
71
-
72
-
73
-
74
-
75
-
76
-
77
-
78
-
79
-
80
-
81
-
82
-
83
-
84
-
85
-
86
-
87
-
 88
88 -
 89
89 -
 90
90 -
 91
91 -
 92
92 -
 93
93 -
 94
94 -
 95
95 -
 96
96 -
 97
97 -
 98
98 -
 99
99 -
 100
100 -
 101
101 -
 102
102 -
 103
103 -
 104
104 -
 105
105 -
 106
106 -
 107
107 -
 108
108 -
109
-
110
-
111
-
112
-
113
-
114
-
115
-
116
-
117
-
118
-
119
-
120
-
121
-
122
-
123
-
124
-
125
-
126
-
127
-
128
-
129
-
130
-
131
-
132
-
133
-
134
-
135
-
136
-
137
-
138
-
139
-
140
-
141
-
142
-
143
-
144
-
145
-
146
-
147
-
148
-
149
-
150
-
151
-
152
-
153
-
154
-
155
-
156
-
157
-
158
-
159
-
160
-
161
-
162
-
163
-
164
-
165
-
166
-
167
-
168
-
169
-
170
-
171
-
172
-
173
-
174
-
175
-
176
-
177
-
178
-
179
-
180
-
181
-
182
-
183
-
184
-
185
-
186
-
187
-
188
-
189
-
190
-
191
-
192
-
193
-
194
-
195
-
196
-
197
-
198
-
199
-
200
-
201
-
202
-
203
-
204
-
205
-
206
-
207
-
208
-
209
-
210
-
211
-
212
-
213
-
214
-
215
-
216
-
217
-
218
-
219
-
220
-
221
-
222
-
223
-
224
-
225
-
226
-
227
-
228
-
229
-
230
-
231
-
232
-
233
-
234
-
235
-
236
-
237
-
238
-
239
 |
 |

94
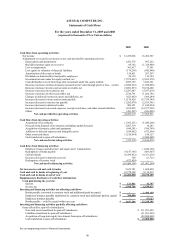
See accompanying notes to financial statements.
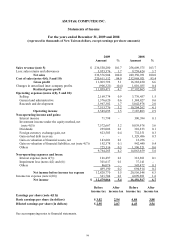
ASUSTeK COMPUTER INC.
Statements of Income
For the years ended December 31, 2009 and 2008
(expressed in thousands of New Taiwan dollars, except earnings per share amounts)
2009 2008
Amount % Amount %
Sales revenue (note 5) $ 236,530,280 101.7 258,609,575 103.7
Less: sales returns and allowances 3,953,376 1.7 9,258,624 3.7
Net sales 232,576,904 100.0 249,350,951 100.0
Cost of sales (notes 4(4), 5 and 10) 220,611,112 94.9 232,968,921 93.4
Gross profit 11,965,792 5.1 16,382,030 6.6
Changes in unrealized inter-company profits (906,321) (0.4) 1,010,035 0.4
Realized gross profit 11,059,471 4.7 17,392,065 7.0
Operating expenses (notes 4(8), 5 and 10):
Selling 2,169,774 0.9 3,776,457 1.5
General and administrative 1,376,620 0.6 1,384,827 0.6
Research and development 3,967,382 1.7 5,042,978 2.0
7,513,776 3.2 10,204,262 4.1
Operating income 3,545,695 1.5 7,187,803 2.9
Non-operating income and gains:
Interest income 71,798 - 300,394 0.1
Investment income under the equity method, net
(note 4(5)) 7,572,667 3.2 9,039,978 3.6
Dividends 235,002 0.1 310,233 0.1
Foreign currency exchange gain, net 823,503 0.4 732,351 0.3
Gain on bad debt recovery - - 1,329,486 0.5
Gain on valuation of financial assets, net 143,601 0.1 12,256 -
Gain on valuation of financial liabilities, net (note 4(7)) 192,378 0.1 942,440 0.4
Others 725,316 0.3 1,396,521 0.6
9,764,265 4.2 14,063,659 5.6
Non-operating expenses and losses:
Interest expense (note 4(7)) 101,497 0.1 312,301 0.1
Impairment loss (notes 4(2) and (6)) 301,617 0.1 37,141 -
Others 86,076 - 345,472 0.1
489,190 0.2 694,914 0.2
Net income before income tax expense 12,820,770 5.5 20,556,548 8.3
Income tax expense (note 4(10)) 341,704 0.1 4,099,981 1.6
Net income $ 12,479,066 5.4 16,456,567 6.7
Before
income tax
After
income tax
Before
income tax
After
income tax
Earnings per share (note 4(11))
Basic earnings per share (in dollars) $ 3.02 2.94 4.84 3.88
Diluted earnings per share (in dollars) $ 2.95 2.87 4.45 3.54