Asus 2009 Annual Report Download - page 97
Download and view the complete annual report
Please find page 97 of the 2009 Asus annual report below. You can navigate through the pages in the report by either clicking on the pages listed below, or by using the keyword search tool below to find specific information within the annual report.-
 1
1 -
2
-
3
-
4
-
5
-
6
-
7
-
8
-
9
-
10
-
11
-
12
-
13
-
14
-
15
-
16
-
17
-
18
-
19
-
20
-
21
-
22
-
23
-
24
-
25
-
26
-
27
-
28
-
29
-
30
-
31
-
32
-
33
-
34
-
35
-
36
-
37
-
38
-
39
-
40
-
41
-
42
-
43
-
44
-
45
-
46
-
47
-
48
-
49
-
50
-
51
-
52
-
53
-
54
-
55
-
56
-
57
-
58
-
59
-
60
-
61
-
62
-
63
-
64
-
65
-
66
-
67
-
68
-
69
-
70
-
71
-
72
-
73
-
74
-
75
-
76
-
77
-
78
-
79
-
80
-
81
-
82
-
83
-
84
-
85
-
86
-
 87
87 -
 88
88 -
 89
89 -
 90
90 -
 91
91 -
 92
92 -
 93
93 -
 94
94 -
 95
95 -
 96
96 -
 97
97 -
 98
98 -
 99
99 -
 100
100 -
 101
101 -
 102
102 -
 103
103 -
 104
104 -
 105
105 -
 106
106 -
 107
107 -
108
-
109
-
110
-
111
-
112
-
113
-
114
-
115
-
116
-
117
-
118
-
119
-
120
-
121
-
122
-
123
-
124
-
125
-
126
-
127
-
128
-
129
-
130
-
131
-
132
-
133
-
134
-
135
-
136
-
137
-
138
-
139
-
140
-
141
-
142
-
143
-
144
-
145
-
146
-
147
-
148
-
149
-
150
-
151
-
152
-
153
-
154
-
155
-
156
-
157
-
158
-
159
-
160
-
161
-
162
-
163
-
164
-
165
-
166
-
167
-
168
-
169
-
170
-
171
-
172
-
173
-
174
-
175
-
176
-
177
-
178
-
179
-
180
-
181
-
182
-
183
-
184
-
185
-
186
-
187
-
188
-
189
-
190
-
191
-
192
-
193
-
194
-
195
-
196
-
197
-
198
-
199
-
200
-
201
-
202
-
203
-
204
-
205
-
206
-
207
-
208
-
209
-
210
-
211
-
212
-
213
-
214
-
215
-
216
-
217
-
218
-
219
-
220
-
221
-
222
-
223
-
224
-
225
-
226
-
227
-
228
-
229
-
230
-
231
-
232
-
233
-
234
-
235
-
236
-
237
-
238
-
239
 |
 |

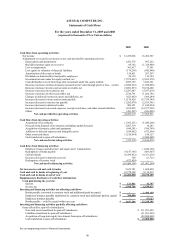
93
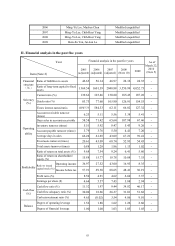
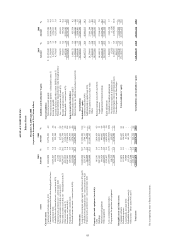
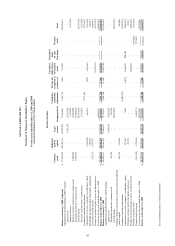
See accompanying notes to financial statements.
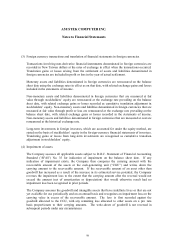
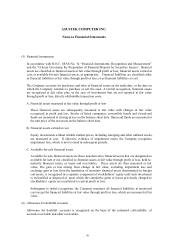
ASUSTeK COMPUTER INC.
Balance Sheets
December 31, 2009 and 2008
(expressed in thousands of New Taiwan dollars)
2009 2008
Assets Amount % Amount %
Current assets:
Cash and cash in banks (note 4(1)) $ 16,402,090 7.2 10,778,309 4.9
Financial assets measured at fair value through profit or loss –
current (note 4(2)) 13,235,827 5.8 8,355,195 3.8
Available-for-sale financial assets – current (note 4(2)) 408,338 0.2 252,588 0.1
Financial assets carried at cost – current (note 4(2)) 41,162 - - -
Notes and accounts receivable, net (note 4(3)) 820,151 0.3 417,660 0.2
Notes and accounts receivable, net – related parties (note 5) 46,266,237 20.2 38,327,768 17.4
Other receivables (note 5) 4,632,939 2.0 6,330,415 2.8
Inventories, net (note 4(4)) 15,087,495 6.6 27,384,938 12.4
Prepaid and other current assets 1,058,208 0.5 1,079,395 0.5
Deferred income tax assets – current (note 4(10)) 1,192,244 0.5 1,270,295 0.6
99,144,691 43.3 94,196,563 42.7
Investments:
Long-term investments under equity method (notes 4(5) and 5) 116,009,948 50.7 117,352,820 53.2
Available-for-sale financial assets – non-current (note 4(2)) 5,535,877 2.4 3,709,117 1.7
Financial assets carried at cost – non-current (note 4(2)) 242,859 0.1 79,210 -
121,788,684 53.2 121,141,147 54.9
Property, plant and equipment (note 4(6)):
Land 981,191 0.4 1,019,424 0.5
Buildings 2,421,641 1.1 2,429,897 1.1
Machinery and equipment 866,628 0.4 848,082 0.4
Other equipment 1,494,377 0.7 2,142,475 1.0
5,763,837 2.6 6,439,878 3.0
Less: accumulated depreciation (1,595,280) (0.7) (1,860,925) (0.8)
Prepayments for purchase of equipment 104,712 - 132,033 -
4,273,269 1.9 4,710,986 2.2
Intangible assets and other assets:
Computer software 174,074 0.1 223,647 0.1
Deferred expenses 119,016 0.1 156,875 0.1
Leased assets, net (note 4(6)) 98,909 - 41,866 -
Refundable deposits and others (note 6) 113,936 - 103,130 -
Other assets – others (notes 4(6) and 7) 3,217,100 1.4 - -
3,723,035 1.6 525,518 0.2
Total assets $ 228,929,679 100.0 220,574,214 100.0
2009 2008
Liabilities and Stockholders’ Equity Amount % Amount %
Current liabilities:
Notes and accounts payable $ 23,251,045 10.2 13,573,906 6.2
Notes and accounts payable – related parties (note 5) 13,536,909 5.9 10,898,504 4.9
Income tax payable 2,477,253 1.1 3,760,131 1.7
Accrued expenses and other current liabilities (note 5) 9,179,685 4.0 8,533,806 3.9
Financial liabilities measured at fair value through profit or
loss – current (notes 4(2) and 4(7)) 285,823 0.1 859,931 0.4
Receipts in advance (note 5) 561,051 0.2 956,724 0.4
Bonds payable – current (note 4(7)) 3,647,296 1.6 12,210,103 5.5
52,939,062 23.1 50,793,105 23.0
Long-term and other liabilities:
Deferred credits (notes 4(2) and 5) 1,430,172 0.6 455,350 0.2
Deferred income tax liabilities and others (note 4(10)) 1,376,468 0.6 2,039,141 1.0
2,806,640 1.2 2,494,491 1.2
Total liabilities 55,745,702 24.3 53,287,596 24.2
Stockholders’ equity:
Common stock (note 4(9)) 42,467,775 18.6 42,460,513 19.2
Additional paid-in capital (note 4(9))
Paid-in capital in excess of par value 28,274,481 12.4 27,861,248 12.6
Others 1,963,105 0.8 1,835,145 0.9
30,237,586 13.2 29,696,393 13.5
Retained earnings (notes 4(9) and 10(3))
Legal reserve 18,910,213 8.3 17,264,557 7.8
Unappropriated retained earnings 77,615,158 33.9 75,738,691 34.3
96,523,610 42.2 93,003,248 42.1
Equity adjustment:
Cumulative translation adjustments 1,490,885 0.7 3,696,120 1.7
Net loss not recognized as pension cost (3,202) - (1,128) -
Unrealized gains (losses) on financial assets 2,159,201 0.9 (1,568,528) (0.7)
Unrealized gains on cash flow hedges 306,361 0.1 - -
3,953,245 1.7 2,126,464 1.0
Total stockholders’ equity 173,183,977 75.7 167,286,618 75.8
Total liabilities and stockholders’ equity $ 228,929,679 100.0 220,574,214 100.0