Asus 2009 Annual Report Download - page 140
Download and view the complete annual report
Please find page 140 of the 2009 Asus annual report below. You can navigate through the pages in the report by either clicking on the pages listed below, or by using the keyword search tool below to find specific information within the annual report.-
 1
1 -
2
-
3
-
4
-
5
-
6
-
7
-
8
-
9
-
10
-
11
-
12
-
13
-
14
-
15
-
16
-
17
-
18
-
19
-
20
-
21
-
22
-
23
-
24
-
25
-
26
-
27
-
28
-
29
-
30
-
31
-
32
-
33
-
34
-
35
-
36
-
37
-
38
-
39
-
40
-
41
-
42
-
43
-
44
-
45
-
46
-
47
-
48
-
49
-
50
-
51
-
52
-
53
-
54
-
55
-
56
-
57
-
58
-
59
-
60
-
61
-
62
-
63
-
64
-
65
-
66
-
67
-
68
-
69
-
70
-
71
-
72
-
73
-
74
-
75
-
76
-
77
-
78
-
79
-
80
-
81
-
82
-
83
-
84
-
85
-
86
-
87
-
88
-
89
-
90
-
91
-
92
-
93
-
94
-
95
-
96
-
97
-
98
-
99
-
100
-
101
-
102
-
103
-
104
-
105
-
106
-
107
-
108
-
109
-
110
-
111
-
112
-
113
-
114
-
115
-
116
-
117
-
118
-
119
-
120
-
121
-
122
-
123
-
124
-
125
-
126
-
127
-
128
-
129
-
 130
130 -
 131
131 -
 132
132 -
 133
133 -
 134
134 -
 135
135 -
 136
136 -
 137
137 -
 138
138 -
 139
139 -
 140
140 -
 141
141 -
 142
142 -
 143
143 -
 144
144 -
 145
145 -
 146
146 -
 147
147 -
 148
148 -
 149
149 -
 150
150 -
151
-
152
-
153
-
154
-
155
-
156
-
157
-
158
-
159
-
160
-
161
-
162
-
163
-
164
-
165
-
166
-
167
-
168
-
169
-
170
-
171
-
172
-
173
-
174
-
175
-
176
-
177
-
178
-
179
-
180
-
181
-
182
-
183
-
184
-
185
-
186
-
187
-
188
-
189
-
190
-
191
-
192
-
193
-
194
-
195
-
196
-
197
-
198
-
199
-
200
-
201
-
202
-
203
-
204
-
205
-
206
-
207
-
208
-
209
-
210
-
211
-
212
-
213
-
214
-
215
-
216
-
217
-
218
-
219
-
220
-
221
-
222
-
223
-
224
-
225
-
226
-
227
-
228
-
229
-
230
-
231
-
232
-
233
-
234
-
235
-
236
-
237
-
238
-
239
 |
 |

136
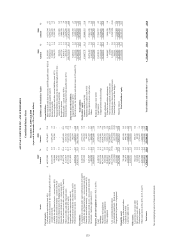
See accompanying notes to financial statements.
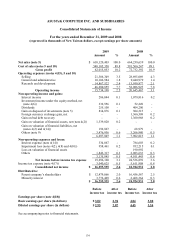
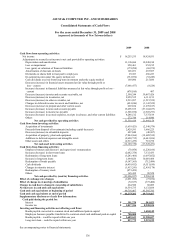
ASUSTeK COMPUTER INC. AND SUBSIDIARIES
Consolidated Statements of Cash Flows
For the years ended December 31, 2009 and 2008
(expressed in thousands of New Taiwan dollars)
2009 2008
Cash flows from operating activities:
Net income $ 16,255,535 18,924,931
Adjustments to reconcile net income to net cash provided by operating activities:
Depreciation and amortization 13,126,684 10,248,180
Loss on impairment 958,461 952,215
Loss (gain) on valuation of financial liabilities (179,298) (68,979)
Amortization of discount on bonds 128,051 267,507
Dividends on shares held in trust paid to employees 69,383 286,223
Investment income under the equity method, net (332,956) (52,249)
Cash dividends received from long-term investment under the equity method 169,090 215,686
Decrease (increase) in financial assets measured at fair value through profit or
loss – current (7,688,477) (8,529)
Increase (decrease) in financial liabilities measured at fair value through profit or loss –
current (878,100) 407
Decrease (increase) in notes and accounts receivable, net 2,509,244 39,887,426
Decrease (increase) in inventories, net 9,959,535 6,131,153
Decrease (increase) in other receivables, net 2,533,997 (1,515,552)
Changes in deferred income tax assets and liabilities, net (401,246) (1,143,529)
Decrease (increase) in prepaid and other current assets 669,654 (1,239,187)
Increase (decrease) in notes and accounts payable 13,698,535 (57,104,837)
Increase (decrease) in income tax payable (1,588,938) (1,905,273)
Increase (decrease) in accrued expenses, receipts in advance, and other current liabilities 4,248,512 7,375,619
Others 272,748 214,946
Net cash provided by operating activities 53,530,414 21,466,158
Cash flows from investing activities:
Acquisition of investments (1,639,421) (2,540,579)
Proceeds from disposal of investments (including capital decrease) 2,429,591 1,666,225
Decrease (increase) in refundable deposits 407,040 (40,307)
Acquisition of property, plant and equipment (7,844,366) (12,689,532)
Additions to deferred expenses and intangible assets (2,628,735) (4,643,036)
Other assets and others (2,913,479) 718,758
Net cash used in investing activities (12,189,370) (17,528,471)
Cash flows from financing activities:
Employee bonuses and directors’ and supervisors’ remuneration (70,958) (1,220,106)
Increase (decrease) in short-term loans (2,082,754) 7,332,433
Redemption of long-term loans (3,243,466) (1,097,852)
Increase in long-term loans 1,698,826 10,001,484
Redemption of bonds payable (9,147,365) (712,499)
Cash dividends (8,439,852) (9,351,630)
Changes in minority interest (1,913,241) (2,456,178)
Redemption of treasury stock (873,459) -
Others 165,432 90,528
Net cash provided by (used in) financing activities (23,906,837) 2,586,180
Effect of exchange rate changes (1,091,395) (75,872)
Effect of change in ownership of subsidiaries (72,657) (375,400)
Change in cash due to change in ownership of subsidiaries 264,580 60,089
Net increase in cash and cash equivalents 16,534,735 6,132,684
Cash and cash equivalents at beginning of period 49,718,467 43,585,783
Cash and cash equivalents at end of period $ 66,253,202 49,718,467
Supplementary disclosures of cash flow information:
Cash paid during the period for:
Interest $ 391,270 501,023
Income tax $ 5,017,356 8,908,524
Investing and financing activities not affecting cash flows:
Bonds payable converted to common stock and additional paid-in capital $ - 1,484,149
Employee bonuses payable transferred to common stock and additional paid-in capital $ 700,000 -
Bonds payable – could be repaid within one year $ 3,609,633 11,988,037
Long-term loan – could be repaid within one year $ 837,772 2,219,239