Asus 2009 Annual Report Download - page 88
Download and view the complete annual report
Please find page 88 of the 2009 Asus annual report below. You can navigate through the pages in the report by either clicking on the pages listed below, or by using the keyword search tool below to find specific information within the annual report.-
 1
1 -
2
-
3
-
4
-
5
-
6
-
7
-
8
-
9
-
10
-
11
-
12
-
13
-
14
-
15
-
16
-
17
-
18
-
19
-
20
-
21
-
22
-
23
-
24
-
25
-
26
-
27
-
28
-
29
-
30
-
31
-
32
-
33
-
34
-
35
-
36
-
37
-
38
-
39
-
40
-
41
-
42
-
43
-
44
-
45
-
46
-
47
-
48
-
49
-
50
-
51
-
52
-
53
-
54
-
55
-
56
-
57
-
58
-
59
-
60
-
61
-
62
-
63
-
64
-
65
-
66
-
67
-
68
-
69
-
70
-
71
-
72
-
73
-
74
-
75
-
76
-
77
-
 78
78 -
 79
79 -
 80
80 -
 81
81 -
 82
82 -
 83
83 -
 84
84 -
 85
85 -
 86
86 -
 87
87 -
 88
88 -
 89
89 -
 90
90 -
 91
91 -
 92
92 -
 93
93 -
 94
94 -
 95
95 -
 96
96 -
 97
97 -
 98
98 -
99
-
100
-
101
-
102
-
103
-
104
-
105
-
106
-
107
-
108
-
109
-
110
-
111
-
112
-
113
-
114
-
115
-
116
-
117
-
118
-
119
-
120
-
121
-
122
-
123
-
124
-
125
-
126
-
127
-
128
-
129
-
130
-
131
-
132
-
133
-
134
-
135
-
136
-
137
-
138
-
139
-
140
-
141
-
142
-
143
-
144
-
145
-
146
-
147
-
148
-
149
-
150
-
151
-
152
-
153
-
154
-
155
-
156
-
157
-
158
-
159
-
160
-
161
-
162
-
163
-
164
-
165
-
166
-
167
-
168
-
169
-
170
-
171
-
172
-
173
-
174
-
175
-
176
-
177
-
178
-
179
-
180
-
181
-
182
-
183
-
184
-
185
-
186
-
187
-
188
-
189
-
190
-
191
-
192
-
193
-
194
-
195
-
196
-
197
-
198
-
199
-
200
-
201
-
202
-
203
-
204
-
205
-
206
-
207
-
208
-
209
-
210
-
211
-
212
-
213
-
214
-
215
-
216
-
217
-
218
-
219
-
220
-
221
-
222
-
223
-
224
-
225
-
226
-
227
-
228
-
229
-
230
-
231
-
232
-
233
-
234
-
235
-
236
-
237
-
238
-
239
 |
 |

84
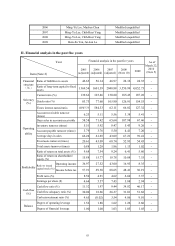
The root causes of the financial ratio change in the last two years:
Ratio of liabilities to assets: Accounts payable for the inventory purchased was increased due to the economic
recovery in 2009Q4.
Ratio of long-term capital to fixed assets: Shareholders’ equity was up and change in fixed assets was insignificant
due to the increase of net income; therefore, Ratio of long-term capital to fixed assets was increased.
Current ratio: Accounts receivable from the sales of goods was increased due to the economic recovery in 2009Q4
and sales growth.
Quick ratio: Accounts receivable from the sales of goods was increased due to the economic recovery in 2009Q4 and
sales growth.
Times interest earned ratio: The amortization of CB in the year was decreased (ASUS CB and ECB were without
interest paid; however, CB discount expense was credited to interest expense in accordance with the new notice even
there was no cash actually paid); therefore, Times interest earned ratio was increased.
Account receivable turnover (times): ASUSTeK had OEM business spited to the subsidiary in the last year;
therefore, the beginning accounts receivable included OEM business and Account receivable turnover (times) of prior
period was low.
Inventory turnover (times): The management of ASUSTeK striven to control inventory level and with lower
inventory amount on the book; therefore, Inventory turnover (times) was low.
Account payable turnover (times): ASUSTeK had OEM business spited to the subsidiary in the last year; therefore,
the beginning accounts payable included OEM business and Account payable turnover (times) of prior period was low.
Total assets turnover (times): The sales revenue of 2009Q1~Q3 was decreased due to recession; therefore, Total
assets turnover (times) was decreased.
Ratio of return on total assets: The net income of was decreased due to recession in 2009Q1~Q3.
Ratio of return on shareholders’ equity: The net income of was decreased due to recession in 2009Q1~Q3.
Ratio of operating income to issued capital stock: The sales revenue was decreased and operating income was
decreased too due to recession in 2009Q1~Q3.
Profit ratio: Profit ratio was reduced due to the severe market competition, selling price adjusted down per the
company’ s policy, and gross profit rate was decreased.
Cash flow ratio: Cash flow ratio was up from the year before due to the effort of the management in controlling
inventory level, reducing total amount of inventory, and causing net cash inflow from operating activity to go up.
Cash flow adequacy ratio: Cash flow adequacy ratio was up from the year before due to the effort of the management
in controlling inventory level, reducing total amount of inventory, and causing net cash inflow from operating activity
to go up.
Cash reinvestment ratio: Cash reinvestment ratio was up from the year before due to the effort of the management in
controlling inventory level, reducing total amount of inventory, and causing net cash inflow from operating activity to
go up.
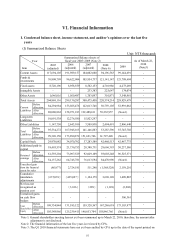
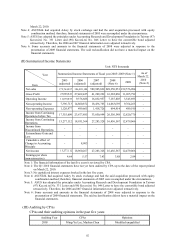
Note 1: ASUS has adopted the principles under Accounting Research and Development Foundation in
Taiwan (97) Kee.mi.tzi No. 331 Letter and (98) Kee.mi.tzi No. 046 Letter to have the convertible
bond adjusted retroactively. Therefore, the 2006 and 007 financial information were adjusted
retroactively.
Note 2: The financial information is reviewed by CPA.
Note 3: Accounts receivable includes the amount of long-term accounts receivable- related party that is in
compliance with trade terms and conditions.
Note 4: ASUS had acquired Askey by stock exchange under Equity Method; therefore, the 2005 financial
statements were adjusted.
Note 5: The Q1 2010 financial statements have not yet been audited by CPA up to the date of the report
printed on March 22, 2010.
Note 6: Equations:
1. Financial structure
(1) Ratio of liabilities to assets = Total liability/Total assets
(2) Ratio of long-Term capital to fixed assets = (Net shareholders’ equity + Long-term liability)
/ Net fixed assets
2. Solvency