Asus 2009 Annual Report Download - page 237
Download and view the complete annual report
Please find page 237 of the 2009 Asus annual report below. You can navigate through the pages in the report by either clicking on the pages listed below, or by using the keyword search tool below to find specific information within the annual report.-
 1
1 -
2
-
3
-
4
-
5
-
6
-
7
-
8
-
9
-
10
-
11
-
12
-
13
-
14
-
15
-
16
-
17
-
18
-
19
-
20
-
21
-
22
-
23
-
24
-
25
-
26
-
27
-
28
-
29
-
30
-
31
-
32
-
33
-
34
-
35
-
36
-
37
-
38
-
39
-
40
-
41
-
42
-
43
-
44
-
45
-
46
-
47
-
48
-
49
-
50
-
51
-
52
-
53
-
54
-
55
-
56
-
57
-
58
-
59
-
60
-
61
-
62
-
63
-
64
-
65
-
66
-
67
-
68
-
69
-
70
-
71
-
72
-
73
-
74
-
75
-
76
-
77
-
78
-
79
-
80
-
81
-
82
-
83
-
84
-
85
-
86
-
87
-
88
-
89
-
90
-
91
-
92
-
93
-
94
-
95
-
96
-
97
-
98
-
99
-
100
-
101
-
102
-
103
-
104
-
105
-
106
-
107
-
108
-
109
-
110
-
111
-
112
-
113
-
114
-
115
-
116
-
117
-
118
-
119
-
120
-
121
-
122
-
123
-
124
-
125
-
126
-
127
-
128
-
129
-
130
-
131
-
132
-
133
-
134
-
135
-
136
-
137
-
138
-
139
-
140
-
141
-
142
-
143
-
144
-
145
-
146
-
147
-
148
-
149
-
150
-
151
-
152
-
153
-
154
-
155
-
156
-
157
-
158
-
159
-
160
-
161
-
162
-
163
-
164
-
165
-
166
-
167
-
168
-
169
-
170
-
171
-
172
-
173
-
174
-
175
-
176
-
177
-
178
-
179
-
180
-
181
-
182
-
183
-
184
-
185
-
186
-
187
-
188
-
189
-
190
-
191
-
192
-
193
-
194
-
195
-
196
-
197
-
198
-
199
-
200
-
201
-
202
-
203
-
204
-
205
-
206
-
207
-
208
-
209
-
210
-
211
-
212
-
213
-
214
-
215
-
216
-
217
-
218
-
219
-
220
-
221
-
222
-
223
-
224
-
225
-
226
-
 227
227 -
 228
228 -
 229
229 -
 230
230 -
 231
231 -
 232
232 -
 233
233 -
 234
234 -
 235
235 -
 236
236 -
 237
237 -
 238
238 -
 239
239
 |
 |

233
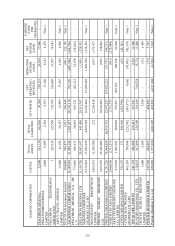
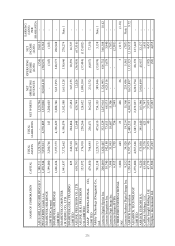
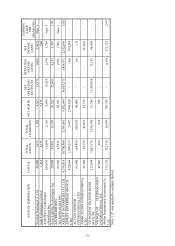
NAME OF CORPORATION CAPITAL TOTAL
ASSETS
TOTAL
LIABILITIES NET WORTH
NET
OPERATING
REVENUES
OPERATING
INCOME
(LOSS)
NET
INCOME
(LOSS)
EARNING
(LOSS)
PER
SHARE(NTD)
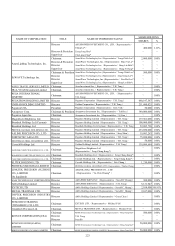
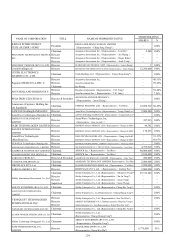
Scientek Nanjiang Co., Ltd. 58,080 5,677 1,110 4,567 13,571 (661) (1,062) Note 1
Jade Technologies Limited 1,433 3,155 - 3,155 - - 660 -
AzureWave Technologies
(ShenZhen) Inc. 104,670 11,080 2,116 8,964 19,385 1,676 1,706 Note 1
AzureLighting Technologies, Inc. 20,000 39,881 13,359 26,522 52,643 6,151 3,707 1.85
AZURELIGHTING
TECHNOLOGIES INC 63,968 63,231 - 63,231 - (738) (746) Note 1
ABILITY ENTERPRISE CO., LTD. 4,374,014 14,700,904 5,398,810 9,302,094 36,607,571 1,856,871 2,152,046 5.00
ABILITY ENTERPRISE (BVI)CO.,
LTD. 820,064 2,950,317 5,497 2,944,820 - (96) 105,294 -
ACTION PIONEER
INTERNATIONAL LTD. 63,980 168,858 108,053 60,805 - (6) (3) -
ASSOCIATION INTERNATIONAL
LTD. 38,388 58,772 43,053 15,719 - - (2,125) -
VIEWQUEST TECHNOLOGIES
(BVI) INC. 212,094 7,607,176 7,590,388 16,788 31,700,824 71,197 94,809 -
VIEWQUEST TECHNOLOGIES
INTERNATIONAL INC. 47,985 622 234 388 - - - -
Ability International Investment Co.,
Ltd. 573,133 722,318 16,989 705,329 - (110) 171,122 2.99
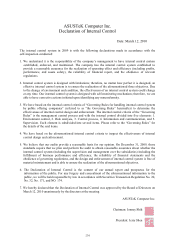
Note 1: It’ s not applied to company limited.