Asus 2009 Annual Report Download - page 75
Download and view the complete annual report
Please find page 75 of the 2009 Asus annual report below. You can navigate through the pages in the report by either clicking on the pages listed below, or by using the keyword search tool below to find specific information within the annual report.-
 1
1 -
2
-
3
-
4
-
5
-
6
-
7
-
8
-
9
-
10
-
11
-
12
-
13
-
14
-
15
-
16
-
17
-
18
-
19
-
20
-
21
-
22
-
23
-
24
-
25
-
26
-
27
-
28
-
29
-
30
-
31
-
32
-
33
-
34
-
35
-
36
-
37
-
38
-
39
-
40
-
41
-
42
-
43
-
44
-
45
-
46
-
47
-
48
-
49
-
50
-
51
-
52
-
53
-
54
-
55
-
56
-
57
-
58
-
59
-
60
-
61
-
62
-
63
-
64
-
 65
65 -
 66
66 -
 67
67 -
 68
68 -
 69
69 -
 70
70 -
 71
71 -
 72
72 -
 73
73 -
 74
74 -
 75
75 -
 76
76 -
 77
77 -
 78
78 -
 79
79 -
 80
80 -
 81
81 -
 82
82 -
 83
83 -
 84
84 -
 85
85 -
86
-
87
-
88
-
89
-
90
-
91
-
92
-
93
-
94
-
95
-
96
-
97
-
98
-
99
-
100
-
101
-
102
-
103
-
104
-
105
-
106
-
107
-
108
-
109
-
110
-
111
-
112
-
113
-
114
-
115
-
116
-
117
-
118
-
119
-
120
-
121
-
122
-
123
-
124
-
125
-
126
-
127
-
128
-
129
-
130
-
131
-
132
-
133
-
134
-
135
-
136
-
137
-
138
-
139
-
140
-
141
-
142
-
143
-
144
-
145
-
146
-
147
-
148
-
149
-
150
-
151
-
152
-
153
-
154
-
155
-
156
-
157
-
158
-
159
-
160
-
161
-
162
-
163
-
164
-
165
-
166
-
167
-
168
-
169
-
170
-
171
-
172
-
173
-
174
-
175
-
176
-
177
-
178
-
179
-
180
-
181
-
182
-
183
-
184
-
185
-
186
-
187
-
188
-
189
-
190
-
191
-
192
-
193
-
194
-
195
-
196
-
197
-
198
-
199
-
200
-
201
-
202
-
203
-
204
-
205
-
206
-
207
-
208
-
209
-
210
-
211
-
212
-
213
-
214
-
215
-
216
-
217
-
218
-
219
-
220
-
221
-
222
-
223
-
224
-
225
-
226
-
227
-
228
-
229
-
230
-
231
-
232
-
233
-
234
-
235
-
236
-
237
-
238
-
239
 |
 |

71
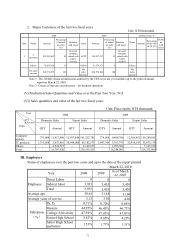
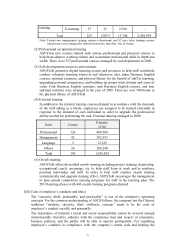
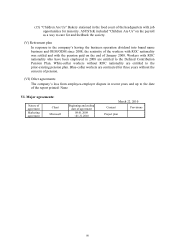
2. Major Customers of the last two fiscal years
Unit: NT$ thousands
2008 2009 2010Q1 (Note 1)
Item Name Amount
Percentage
of annual
net sales
(%)
Relation
with issuer Name Amount
Percentage
of annual
net sales
(%)
Relation
with issuer
Name
Amount
Percentage
of net sales
of Q1 (%)
Relati
on
with
issuer
1 A
customer 203,543,087 82
Invested
company
valued with
equity
method
ASTP 210,597,333 91
Invested
company
valued with
equity
method
Others 45,807,864 18 Others 21,979,571 9 Others
Net sales
amount 249,350,951 100
Net
sales
amount
232,576,904 100
Net
sales
amount
Note 1: The 2010Q1 financial statements audited by the CPA were not yet available up to the print of annual
report on March 22, 2010.
Note 2: Causes of increase and decrease – for business operation
(V) Production/Sales Quantities and Value over the Past Two Year: N/A
(VI) Sales quantities and value of the last two fiscal years:
Unit: Piece (unit); NT$ thousands
2008 2009
Domestic Sales Export Sales Domestic Sales Export Sales
QTY Amount QTY Amount QTY Amount QTY Amount
Computer
system 753,088 11,417,890 12,937,840 161,222,785 779,560 9,484,706 12,309,452 159,289,851
3C products 1,713,058 2,453,463 38,444,080 65,182,573 1,847,744 3,763,793 32,910,343 51,875,178
Others - 4,924,567 - 4,149,673 - 2,995,506 - 5,167,870
Total - 18,795,920 - 230,555,031 - 16,244,005 - 216,332,899
III. Employees
Status of employees over the past two years and up to the date of the report printed
March 22, 2010
Year 2008 2009 As of March
22, 2010
Employee
Direct Labor 0 0 0
Indirect labor 3,933 3,455 3,430
Total 3,933 3,455 3,430
Average age 30.61 31.44 31.60
Average years of service 3.13 3.92 4.02
Education
(%)
Ph. D. 0.71% 0.70% 0.64%
Masters 44.95% 46.45% 46.73%
College /University 47.39% 47.03% 47.03%
Senior High School 5.42% 4.05% 4.29%
Junior High School
and below 1.53% 1.77% 1.31%
Year
QTY
& Amount
Items