Asus 2009 Annual Report Download - page 138
Download and view the complete annual report
Please find page 138 of the 2009 Asus annual report below. You can navigate through the pages in the report by either clicking on the pages listed below, or by using the keyword search tool below to find specific information within the annual report.-
 1
1 -
2
-
3
-
4
-
5
-
6
-
7
-
8
-
9
-
10
-
11
-
12
-
13
-
14
-
15
-
16
-
17
-
18
-
19
-
20
-
21
-
22
-
23
-
24
-
25
-
26
-
27
-
28
-
29
-
30
-
31
-
32
-
33
-
34
-
35
-
36
-
37
-
38
-
39
-
40
-
41
-
42
-
43
-
44
-
45
-
46
-
47
-
48
-
49
-
50
-
51
-
52
-
53
-
54
-
55
-
56
-
57
-
58
-
59
-
60
-
61
-
62
-
63
-
64
-
65
-
66
-
67
-
68
-
69
-
70
-
71
-
72
-
73
-
74
-
75
-
76
-
77
-
78
-
79
-
80
-
81
-
82
-
83
-
84
-
85
-
86
-
87
-
88
-
89
-
90
-
91
-
92
-
93
-
94
-
95
-
96
-
97
-
98
-
99
-
100
-
101
-
102
-
103
-
104
-
105
-
106
-
107
-
108
-
109
-
110
-
111
-
112
-
113
-
114
-
115
-
116
-
117
-
118
-
119
-
120
-
121
-
122
-
123
-
124
-
125
-
126
-
127
-
 128
128 -
 129
129 -
 130
130 -
 131
131 -
 132
132 -
 133
133 -
 134
134 -
 135
135 -
 136
136 -
 137
137 -
 138
138 -
 139
139 -
 140
140 -
 141
141 -
 142
142 -
 143
143 -
 144
144 -
 145
145 -
 146
146 -
 147
147 -
 148
148 -
149
-
150
-
151
-
152
-
153
-
154
-
155
-
156
-
157
-
158
-
159
-
160
-
161
-
162
-
163
-
164
-
165
-
166
-
167
-
168
-
169
-
170
-
171
-
172
-
173
-
174
-
175
-
176
-
177
-
178
-
179
-
180
-
181
-
182
-
183
-
184
-
185
-
186
-
187
-
188
-
189
-
190
-
191
-
192
-
193
-
194
-
195
-
196
-
197
-
198
-
199
-
200
-
201
-
202
-
203
-
204
-
205
-
206
-
207
-
208
-
209
-
210
-
211
-
212
-
213
-
214
-
215
-
216
-
217
-
218
-
219
-
220
-
221
-
222
-
223
-
224
-
225
-
226
-
227
-
228
-
229
-
230
-
231
-
232
-
233
-
234
-
235
-
236
-
237
-
238
-
239
 |
 |

134
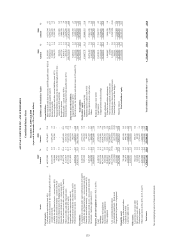
See accompanying notes to financial statements.
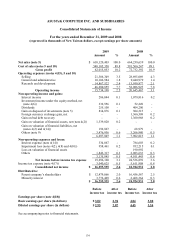
ASUSTeK COMPUTER INC. AND SUBSIDIARIES
Consolidated Statements of Income
For the years ended December 31, 2009 and 2008
(expressed in thousands of New Taiwan dollars, except earnings per share amounts)
2009 2008
Amount % Amount %
Net sales (note 5) $ 610,120,403 100.0 664,238,639 100.0
Cost of sales (notes 5 and 10) 548,105,350 89.8 591,506,247 89.1
Gross profit 62,015,053 10.2 72,732,392 10.9
Operating expenses: (notes 4(15), 5 and 10)
Selling 21,306,349 3.5 28,695,069 4.3
General and administrative 10,106,984 1.8 9,440,979 1.4
Research and development 14,867,522 2.4 13,950,877 2.1
46,280,855 7.7 52,086,925 7.8
Operating income 15,734,198 2.5 20,645,467 3.1
Non-operating income and gains:
Interest income 286,044 0.1 1,078,816 0.2
Investment income under the equity method, net
(note 4(6)) 332,956 0.1 52,249 -
Dividends 255,108 - 404,200 -
Gain on disposal of investments (note 5) 814,876 0.1 304,315 -
Foreign currency exchange gain, net - - 1,366,308 0.2
Gain on bad debt recovery - - 1,360,968 0.2
Gain on valuation of financial assets, net (note 4(2)) 1,339,020 0.2 - -
Gain on valuation of financial liabilities, net
(notes 4(2) and 4(14)) 192,867 - 68,979 -
Others (note 9) 3,476,936 0.6 3,266,980 0.5
6,697,807 1.1 7,902,815 1.1
Non-operating expenses and losses:
Interest expense (note 4(14)) 334,067 - 784,603 0.2
Impairment loss (notes 4(2), 4(8) and 4(10)) 958,461 0.2 952,215 0.1
Loss on valuation of financial assets - - 190,992 -
Others 1,843,317 0.3 2,083,633 0.3
3,135,845 0.5 4,011,443 0.6
Net income before income tax expense 19,296,160 3.1 24,536,839 3.6
Income tax expense (note 4(17)) 3,040,625 0.5 5,611,908 0.8
Consolidated net income $ 16,255,535 2.6 18,924,931 2.8
Distributed to:
Parent company’ s shareholders $ 12,479,066 2.0 16,456,567 2.5
Minority interest 3,776,469 0.6 2,468,364 0.3
$ 16,255,535 2.6 18,924,931 2.8
Before
income tax
After
income tax
Before
income tax
After
income tax
Earnings per share (note 4(18))
Basic earnings per share (in dollars) $ 3.02 2.94 4.84 3.88
Diluted earnings per share (in dollars) $ 2.95 2.87 4.45 3.54