Asus 2009 Annual Report Download - page 137
Download and view the complete annual report
Please find page 137 of the 2009 Asus annual report below. You can navigate through the pages in the report by either clicking on the pages listed below, or by using the keyword search tool below to find specific information within the annual report.-
 1
1 -
2
-
3
-
4
-
5
-
6
-
7
-
8
-
9
-
10
-
11
-
12
-
13
-
14
-
15
-
16
-
17
-
18
-
19
-
20
-
21
-
22
-
23
-
24
-
25
-
26
-
27
-
28
-
29
-
30
-
31
-
32
-
33
-
34
-
35
-
36
-
37
-
38
-
39
-
40
-
41
-
42
-
43
-
44
-
45
-
46
-
47
-
48
-
49
-
50
-
51
-
52
-
53
-
54
-
55
-
56
-
57
-
58
-
59
-
60
-
61
-
62
-
63
-
64
-
65
-
66
-
67
-
68
-
69
-
70
-
71
-
72
-
73
-
74
-
75
-
76
-
77
-
78
-
79
-
80
-
81
-
82
-
83
-
84
-
85
-
86
-
87
-
88
-
89
-
90
-
91
-
92
-
93
-
94
-
95
-
96
-
97
-
98
-
99
-
100
-
101
-
102
-
103
-
104
-
105
-
106
-
107
-
108
-
109
-
110
-
111
-
112
-
113
-
114
-
115
-
116
-
117
-
118
-
119
-
120
-
121
-
122
-
123
-
124
-
125
-
126
-
 127
127 -
 128
128 -
 129
129 -
 130
130 -
 131
131 -
 132
132 -
 133
133 -
 134
134 -
 135
135 -
 136
136 -
 137
137 -
 138
138 -
 139
139 -
 140
140 -
 141
141 -
 142
142 -
 143
143 -
 144
144 -
 145
145 -
 146
146 -
 147
147 -
148
-
149
-
150
-
151
-
152
-
153
-
154
-
155
-
156
-
157
-
158
-
159
-
160
-
161
-
162
-
163
-
164
-
165
-
166
-
167
-
168
-
169
-
170
-
171
-
172
-
173
-
174
-
175
-
176
-
177
-
178
-
179
-
180
-
181
-
182
-
183
-
184
-
185
-
186
-
187
-
188
-
189
-
190
-
191
-
192
-
193
-
194
-
195
-
196
-
197
-
198
-
199
-
200
-
201
-
202
-
203
-
204
-
205
-
206
-
207
-
208
-
209
-
210
-
211
-
212
-
213
-
214
-
215
-
216
-
217
-
218
-
219
-
220
-
221
-
222
-
223
-
224
-
225
-
226
-
227
-
228
-
229
-
230
-
231
-
232
-
233
-
234
-
235
-
236
-
237
-
238
-
239
 |
 |

133
See accompanying notes to financial statements.
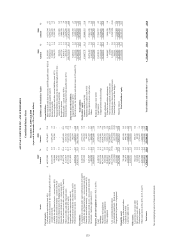
ASUSTeK COMPUTER INC. AND SUBSIDIARIES
Consolidated Balance Sheets
December 31, 2009 and 2008
(expressed in thousands of New Taiwan dollars)
2009 2008
Assets Amount % Amount %
Current assets:
Cash and cash equivalents (note 4(1)) $ 66,253,202 17.9 49,718,467 13.9
Financial assets measured at fair value through profit or loss –
current (note 4(2)) 21,657,195 5.9 13,295,479 3.7
Available-for-sale financial assets – current (note 4(2)) 1,848,464 0.5 516,306 0.1
Financial assets held to maturity – current (note 4(2)) 16,425 - - -
Derivative financial assets for hedging (note 4(3)) 306,361 0.1 - -
Financial assets carried at cost – current (note 4(2)) 41,162 - - -
Notes and accounts receivable, net (notes 4(4), 5 and 6) 87,485,778 23.6 89,893,998 25.1
Other receivables and other financial assets 6,123,019 1.7 8,615,382 2.4
Inventories, net (notes 4(5) and 6) 87,737,192 23.7 97,457,070 27.2
Prepaid and other current assets (note 6) 4,211,029 1.1 4,219,874 1.2
Non-current assets held for sale (notes 4(9) and 5) - - 182,876 -
Deferred income tax assets – current (note 4(17)) 2,607,912 0.7 2,829,817 0.8
278,287,739 75.2 266,729,269 74.4
Investments:
Long-term investments under equity method (notes 4(6) and 5) 2,145,776 0.6 2,773,575 0.9
Available-for-sale financial assets – non-current (note 4(2)) 7,805,382 2.1 4,556,392 1.2
Financial assets held to maturity – non-current (note 4(2)) - - 16,425 -
Financial assets carried at cost – non-current (note 4(2)) 2,421,049 0.7 2,477,410 0.7
Investment – land use right (note 4(11)) 432,705 0.1 443,246 0.1
12,804,912 3.5 10,267,048 2.9
Property, plant and equipment (notes 4(8), 5 and 6):
Land 4,349,763 1.2 4,725,655 1.3
Buildings 29,872,128 8.1 27,110,509 7.6
Machinery and equipment 48,315,649 13.1 50,830,334 14.2
Instruments and equipment 3,603,244 0.9 3,330,385 0.9
Other equipment 10,404,413 2.8 9,293,174 2.6
96,545,197 26.1 95,290,057 26.6
Less: accumulated depreciation (34,115,550) (9.2) (29,176,055) (8.1)
Accumulated impairment – fixed assets (235,304) - (617,339) (0.2)
Prepayments for purchase of equipment 2,522,562 0.6 5,355,254 1.5
64,716,905 17.5 70,851,917 19.8
Intangible assets:
Computer software and others 741,168 0.2 853,108 0.2
Goodwill (note 4(10)) 962,876 0.3 890,146 0.3
Land use rights (note 6) 2,618,687 0.7 2,580,836 0.7
4,322,731 1.2 4,324,090 1.2
Other assets:
Leased assets, net (note 4(8)) 882,127 0.2 858,767 0.2
Idle assets (notes 4(8) and 6) 847,258 0.2 80,549 -
Deferred expenses 3,577,742 1.0 3,751,627 1.1
Other assets (notes 4(10), 4(15), 4(17), 6 and 7) 4,567,688 1.2 1,424,998 0.4
9,874,815 2.6 6,115,941 1.7
Total assets $ 370,007,102 100.0 358,288,265 100.0
2009 2008
Liabilities and Stockholders’ Equity Amount % Amount %
Current liabilities:
Short-term debt and short-term notes and bills payable (notes 4(12)) $ 12,503,033 3.4 14,573,844 4.1
Notes and accounts payable (note 5) 98,634,612 26.7 84,892,167 23.7
Income tax payable 3,950,865 1.1 5,504,329 1.5
Accrued expenses and other current liabilities (note 4(17)) 36,306,121 9.8 31,292,346 8.7
Financial liabilities measured at fair value through profit or loss –
current (notes 4(2) and 4(14)) 283,596 0.1 1,721,005 0.5
Receipts in advance 4,627,738 1.2 5,484,328 1.5
Bonds payable – current (note 4(14)) 3,609,633 1.0 11,988,037 3.4
Current portion of long-term loans payable (note 4(13)) 837,772 0.2 2,219,239 0.6
160,753,370 43.5 157,675,295 44.0
Long-term and other liabilities:
Long-term debt (note 4(13)) 9,486,372 2.5 9,750,388 2.7
Deferred income tax liabilities and others (notes 4(15) and 4(17)) 2,116,396 0.6 2,680,167 0.8
11,602,768 3.1 12,430,555 3.5
Total liabilities 172,356,138 46.6 170,105,850 47.5
Stockholders’ equity:
Common stock (note 4(16)) 42,467,775 11.5 42,460,513 11.8
Additional paid-in capital: (note 4(16))
Paid-in capital in excess of par value 28,274,481 7.6 27,861,248 7.8
Others 1,963,105 0.5 1,835,145 0.5
30,237,586 8.1 29,696,393 8.3
Retained earnings: (note 4(16))
Legal reserve 18,910,213 5.1 17,264,557 4.9
Unappropriated retained earnings 77,615,158 21.0 75,738,691 21.1
96,525,371 26.1 93,003,248 26.0
Equity adjustment:
Cumulative translation adjustments 1,490,885 0.4 3,696,120 1.0
Net loss not recognized as pension cost (3,202) - (1,128) -
Unrealized gains (losses) on financial assets 2,159,201 0.6 (1,568,528) (0.4)
Unrealized gains on cash flow hedges 306,361 0.1 - -
3,953,245 1.1 2,126,464 0.6
Minority interest 24,466,987 6.6 20,895,797 5.8
Total stockholders’ equity 197,650,964 53.4 188,182,415 52.5
Total liabilities and stockholders’ equity $ 370,007,102 100.0 358,288,265 100.0