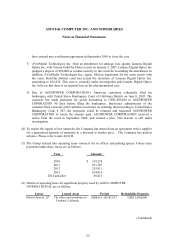
Asus 2009 Annual Report Download - page 200
Download and view the complete annual report
Please find page 200 of the 2009 Asus annual report below. You can navigate through the pages in the report by either clicking on the pages listed below, or by using the keyword search tool below to find specific information within the annual report.-
 1
1 -
2
-
3
-
4
-
5
-
6
-
7
-
8
-
9
-
10
-
11
-
12
-
13
-
14
-
15
-
16
-
17
-
18
-
19
-
20
-
21
-
22
-
23
-
24
-
25
-
26
-
27
-
28
-
29
-
30
-
31
-
32
-
33
-
34
-
35
-
36
-
37
-
38
-
39
-
40
-
41
-
42
-
43
-
44
-
45
-
46
-
47
-
48
-
49
-
50
-
51
-
52
-
53
-
54
-
55
-
56
-
57
-
58
-
59
-
60
-
61
-
62
-
63
-
64
-
65
-
66
-
67
-
68
-
69
-
70
-
71
-
72
-
73
-
74
-
75
-
76
-
77
-
78
-
79
-
80
-
81
-
82
-
83
-
84
-
85
-
86
-
87
-
88
-
89
-
90
-
91
-
92
-
93
-
94
-
95
-
96
-
97
-
98
-
99
-
100
-
101
-
102
-
103
-
104
-
105
-
106
-
107
-
108
-
109
-
110
-
111
-
112
-
113
-
114
-
115
-
116
-
117
-
118
-
119
-
120
-
121
-
122
-
123
-
124
-
125
-
126
-
127
-
128
-
129
-
130
-
131
-
132
-
133
-
134
-
135
-
136
-
137
-
138
-
139
-
140
-
141
-
142
-
143
-
144
-
145
-
146
-
147
-
148
-
149
-
150
-
151
-
152
-
153
-
154
-
155
-
156
-
157
-
158
-
159
-
160
-
161
-
162
-
163
-
164
-
165
-
166
-
167
-
168
-
169
-
170
-
171
-
172
-
173
-
174
-
175
-
176
-
177
-
178
-
179
-
180
-
181
-
182
-
183
-
184
-
185
-
186
-
187
-
188
-
189
-
 190
190 -
 191
191 -
 192
192 -
 193
193 -
 194
194 -
 195
195 -
 196
196 -
 197
197 -
 198
198 -
 199
199 -
 200
200 -
 201
201 -
 202
202 -
 203
203 -
 204
204 -
 205
205 -
 206
206 -
 207
207 -
 208
208 -
 209
209 -
 210
210 -
211
-
212
-
213
-
214
-
215
-
216
-
217
-
218
-
219
-
220
-
221
-
222
-
223
-
224
-
225
-
226
-
227
-
228
-
229
-
230
-
231
-
232
-
233
-
234
-
235
-
236
-
237
-
238
-
239
 |
 |

196
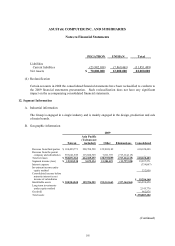
ASUSTeK COMPUTER INC. AND SUBSIDIARIES
Notes to Financial Statements
2008
Taiwan
Asia Pacific
(Taiwan not
included ) Other Eliminations Consolidated
Revenue from third parties $ 363,753,539 288,604,157 11,880,943 - 664,238,639
Revenue from the parent
company and subsidiaries 424,542,606 144,513,742 13,553,753 (582,610,101) -
Total revenues $ 788,296,145 433,117,899 25,434,696 (582,610,101) 664,238,639
Segment income (loss) $ 19,232,028 8,999,244 12,785,951 (15,748,030) 25,269,193
Interest expense (784,603)
Investment income under
equity method
52,249
Consolidated income before
minority interest in net
income of subsidiaries
$ 24,536,839
Identifiable assets $ 252,630,502 146,640,841 255,383,494 (300,030,293) 354,624,544
Long-term investments
under equity method
2,773,575
Goodwill 890,146
Total assets $ 358,288,265
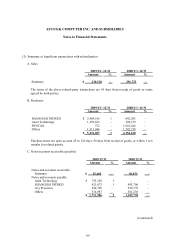
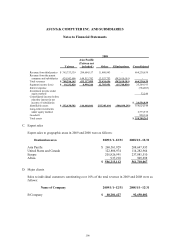
C. Export sales
Export sales to geographic areas in 2009 and 2008 were as follows:
Destination area 2009/1/1~12/31 2008/1/1~12/31
Asia Pacific $ 260,561,929 208,647,935
United States and Canada 122,886,974 114,282,964
Europe 201,826,991 237,881,510
Africa 937,218 905,658
$ 586,213,112 561,718,067
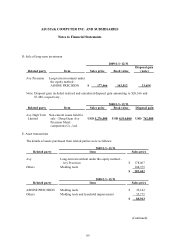
D. Major clients
Sales to individual customers constituting over 10% of the total revenue in 2009 and 2008 were as
follows:
Name of Company 2009/1/1~12/31 2008/1/1~12/31
B Company $ 80,201,427 92,658,082