Asus 2009 Annual Report Download - page 57
Download and view the complete annual report
Please find page 57 of the 2009 Asus annual report below. You can navigate through the pages in the report by either clicking on the pages listed below, or by using the keyword search tool below to find specific information within the annual report.-
 1
1 -
2
-
3
-
4
-
5
-
6
-
7
-
8
-
9
-
10
-
11
-
12
-
13
-
14
-
15
-
16
-
17
-
18
-
19
-
20
-
21
-
22
-
23
-
24
-
25
-
26
-
27
-
28
-
29
-
30
-
31
-
32
-
33
-
34
-
35
-
36
-
37
-
38
-
39
-
40
-
41
-
42
-
43
-
44
-
45
-
46
-
 47
47 -
 48
48 -
 49
49 -
 50
50 -
 51
51 -
 52
52 -
 53
53 -
 54
54 -
 55
55 -
 56
56 -
 57
57 -
 58
58 -
 59
59 -
 60
60 -
 61
61 -
 62
62 -
 63
63 -
 64
64 -
 65
65 -
 66
66 -
 67
67 -
68
-
69
-
70
-
71
-
72
-
73
-
74
-
75
-
76
-
77
-
78
-
79
-
80
-
81
-
82
-
83
-
84
-
85
-
86
-
87
-
88
-
89
-
90
-
91
-
92
-
93
-
94
-
95
-
96
-
97
-
98
-
99
-
100
-
101
-
102
-
103
-
104
-
105
-
106
-
107
-
108
-
109
-
110
-
111
-
112
-
113
-
114
-
115
-
116
-
117
-
118
-
119
-
120
-
121
-
122
-
123
-
124
-
125
-
126
-
127
-
128
-
129
-
130
-
131
-
132
-
133
-
134
-
135
-
136
-
137
-
138
-
139
-
140
-
141
-
142
-
143
-
144
-
145
-
146
-
147
-
148
-
149
-
150
-
151
-
152
-
153
-
154
-
155
-
156
-
157
-
158
-
159
-
160
-
161
-
162
-
163
-
164
-
165
-
166
-
167
-
168
-
169
-
170
-
171
-
172
-
173
-
174
-
175
-
176
-
177
-
178
-
179
-
180
-
181
-
182
-
183
-
184
-
185
-
186
-
187
-
188
-
189
-
190
-
191
-
192
-
193
-
194
-
195
-
196
-
197
-
198
-
199
-
200
-
201
-
202
-
203
-
204
-
205
-
206
-
207
-
208
-
209
-
210
-
211
-
212
-
213
-
214
-
215
-
216
-
217
-
218
-
219
-
220
-
221
-
222
-
223
-
224
-
225
-
226
-
227
-
228
-
229
-
230
-
231
-
232
-
233
-
234
-
235
-
236
-
237
-
238
-
239
 |
 |
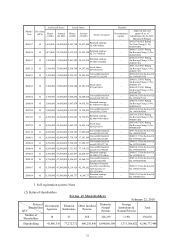
53
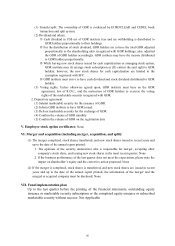
Shareholding
Shareholder’ s Name
Shareholding Shareholding Ratio (%)
Jonney Shih’ s trust account with the First Bank 60,000,000 1.41%
Rabobank’ s investment account of CitiBank
(Taiwan) 55,062,713 1.30%
Civil Servants Pension Fund Commission 51,575,426 1.21%
T.S. Tong’ s trust account with Chinatrust 50,000,000 1.18%
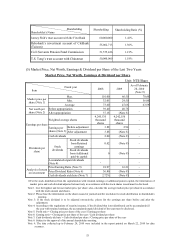
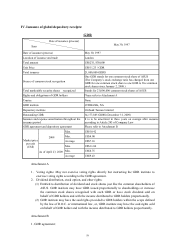
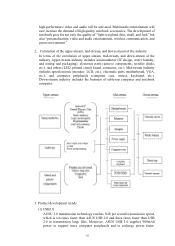
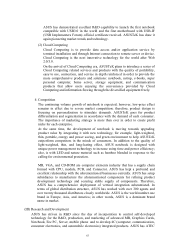
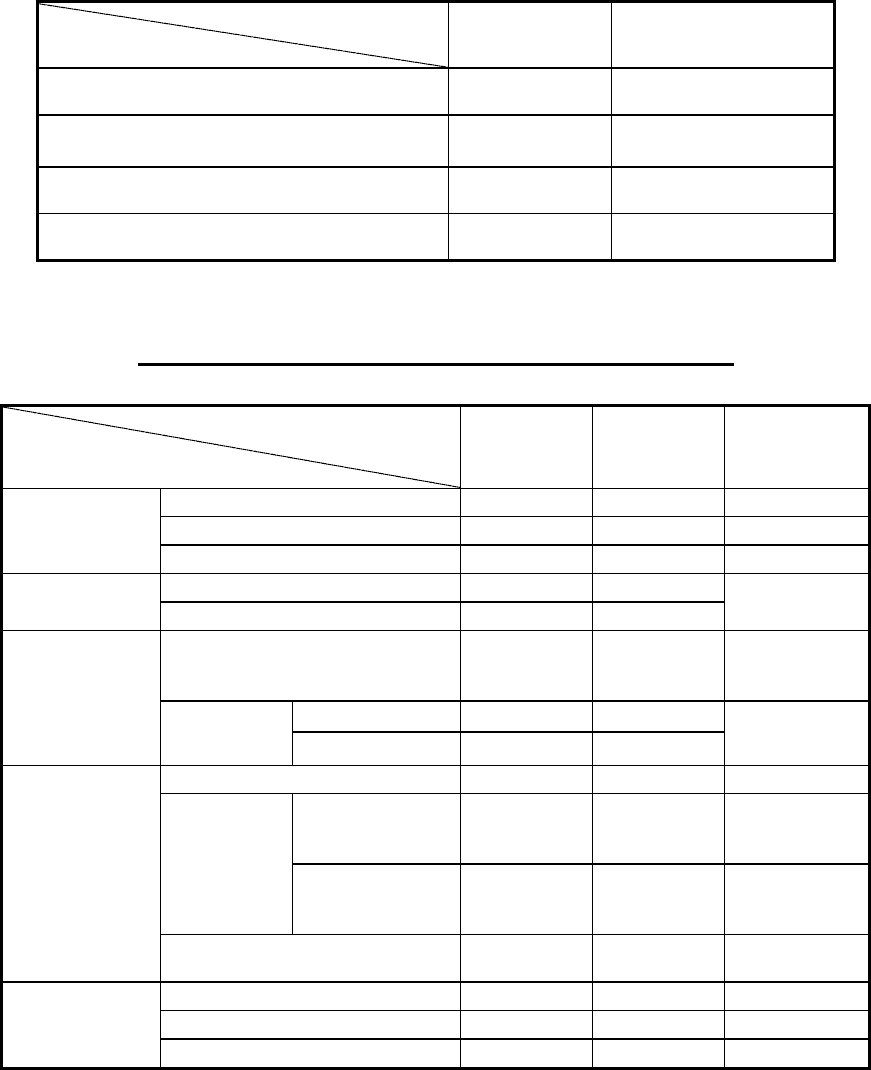
(5) Market Price, Net Worth, Earnings & Dividend per Share of the Last Two Years
Market Price, Net Worth, Earnings & Dividend per Share
Unit: NT$/Share
Fiscal year
Item 2008 2009
As of February
28, 2010
(Note 9)
Market price per
share (Note 1)
Max. 101.00 66.50 70.60
Min. 32.05 29.50 56.00
Average 73.60 47.66 63.59
Net worth per
share (Note 2)
Before appropriation 39.40 40.78 -
After appropriation 37.18 (Note 8)
Earnings per share
Weighted average shares
4,245,535
thousand
shares
4,242,156
thousand
shares
-
Earnings per
shares (Note 3)
Before adjustment 3.88 2.94 -
After adjustment 3.88 (Note 8)
Dividends per
share
Cash dividends 2.00 (Note 8) -
Stock
dividends
Stock dividends
from Retained
earnings
0.02 (Note 8) -
Stock dividends
from Additional
paid-in capital
0 (Note 8) -
Accumulated unpaid dividends
(Note 4) - - -
Analysis of return
on investment
Price/Earning Ratio (Note 5) 18.97 16.21 -
Price/Dividend Ratio (Note 6) 36.80 (Note 8) -
Cash dividends yield rate (Note 7) 2.72% (Note 8) -
*For the stock distribution from the capitalization with retained earnings or additional pain-in capital, the information of
market price and cash dividend adjusted retroactively in accordance with the stock shares issued must be disclosed.
Note 1: List the highest and lowest market price per share; also, calculate the average market price per share in accordance
with the trade amount and shares.
Note 2: Please base the information on the shares issued at yearned and the resolution for stock distribution in shareholders
meeting.
Note 3: If the stock dividend is to be adjusted retroactively, please list the earnings per share before and after the
adjustment.
Note 4: According to the regulations of security issuance, if the dividend that is not distributed can be accumulated till
the year with retained earnings, the accumulated unpaid dividend of the year must be disclosed.
Note 5: Profit ratio = Closing price per share of the year / Earning per share
Note 6: Earning ratio = Closing price per share of the year / Cash dividend per share
Note 7: Cash dividend yield rate = Cash dividend per share / Closing price per share of the year
Note 8: Subject to the approval of the annual shareholders meeting.
Note 9: The data collected up to February 28, 2010 were included in the report printed on March 22, 2010 for data
accuracy.