Asus 2009 Annual Report Download - page 202
Download and view the complete annual report
Please find page 202 of the 2009 Asus annual report below. You can navigate through the pages in the report by either clicking on the pages listed below, or by using the keyword search tool below to find specific information within the annual report.-
 1
1 -
2
-
3
-
4
-
5
-
6
-
7
-
8
-
9
-
10
-
11
-
12
-
13
-
14
-
15
-
16
-
17
-
18
-
19
-
20
-
21
-
22
-
23
-
24
-
25
-
26
-
27
-
28
-
29
-
30
-
31
-
32
-
33
-
34
-
35
-
36
-
37
-
38
-
39
-
40
-
41
-
42
-
43
-
44
-
45
-
46
-
47
-
48
-
49
-
50
-
51
-
52
-
53
-
54
-
55
-
56
-
57
-
58
-
59
-
60
-
61
-
62
-
63
-
64
-
65
-
66
-
67
-
68
-
69
-
70
-
71
-
72
-
73
-
74
-
75
-
76
-
77
-
78
-
79
-
80
-
81
-
82
-
83
-
84
-
85
-
86
-
87
-
88
-
89
-
90
-
91
-
92
-
93
-
94
-
95
-
96
-
97
-
98
-
99
-
100
-
101
-
102
-
103
-
104
-
105
-
106
-
107
-
108
-
109
-
110
-
111
-
112
-
113
-
114
-
115
-
116
-
117
-
118
-
119
-
120
-
121
-
122
-
123
-
124
-
125
-
126
-
127
-
128
-
129
-
130
-
131
-
132
-
133
-
134
-
135
-
136
-
137
-
138
-
139
-
140
-
141
-
142
-
143
-
144
-
145
-
146
-
147
-
148
-
149
-
150
-
151
-
152
-
153
-
154
-
155
-
156
-
157
-
158
-
159
-
160
-
161
-
162
-
163
-
164
-
165
-
166
-
167
-
168
-
169
-
170
-
171
-
172
-
173
-
174
-
175
-
176
-
177
-
178
-
179
-
180
-
181
-
182
-
183
-
184
-
185
-
186
-
187
-
188
-
189
-
190
-
191
-
 192
192 -
 193
193 -
 194
194 -
 195
195 -
 196
196 -
 197
197 -
 198
198 -
 199
199 -
 200
200 -
 201
201 -
 202
202 -
 203
203 -
 204
204 -
 205
205 -
 206
206 -
 207
207 -
 208
208 -
 209
209 -
 210
210 -
 211
211 -
 212
212 -
213
-
214
-
215
-
216
-
217
-
218
-
219
-
220
-
221
-
222
-
223
-
224
-
225
-
226
-
227
-
228
-
229
-
230
-
231
-
232
-
233
-
234
-
235
-
236
-
237
-
238
-
239
 |
 |

198
Item 2009 2008 Amount change Ratio change (%)
Realized gross profit 11,059,471 17,392,065 (6,332,594) (36.41)
Operating expense (7,513,776) (10,204,262) 2,690,486 (26.37)
Operating income 3,545,695 7,187,803 (3,642,108) (50.67)
Non-operating income and gain
Interest income 71,798 300,394 (228,596) (76.10)
Investment income (Equity
Method) 7,572,667 9,039,978 (1,467,311) (16.23)
Dividend income 235,002 310,233 (75,231) (24.25)
Gain from exchange 823,503 732,351 91,152 12.45
Gain from reversal of bad
debts - 1,329,486 (1,329,486) (100.00)
Gain from financial asset
valuation 143,601 12,256 131,345 1,071.68
Gain from financial liability
valuation 192,378 942,440 (750,062) (79.59)
Other income 725,316 1,396,521 (671,205) (48.06)
Total non-operating income
and gain 9,764,265 14,063,659 (4,299,394) (30.57)
Non-operating expense and loss
Interest expense 101,497 312,301 (210,804) (67.50)
Impairment loss 301,617 37,141 264,476 712.09
Other loss 86,076 345,472 (259,396) (75.08)
Total Non-operating
expense and loss 489,190 694,914 (205,724) (29.60)
Net income before tax 12,820,770 20,556,548 (7,735,778) (37.63)
Minus: Estimated income tax (341,704) (4,099,981) 3,758,277 (91.67)
Net income $12,479,066 $16,456,567 (3,977,501) (24.17)
Analysis of financial ratio change:
1. Operating income and operating cost: Sales revenue did not grow until 2009Q4 due to the recession
extended from 2008Q4 to early 2009.
2. Operating expense: Sales expense and R&D expense were reduced by sizing down the organization and
manpower and controlling expenses strictly.
3. Non-operating income and gain: The decline of non-operating income and gain in the year was due to the
investment income valued with equity method was less than the year before; also, the conversion of bad
debt to earnings in the year was less than the year before also.
4. Estimated income tax expense:The decline of estimated income tax expense in the year was due to the
reduction of income tax levied in the year.
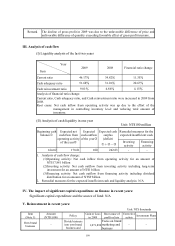
(II) Analysis of gross profit
Unit: NT$ Thousands
Change amount
Root cause
Difference of price Difference of sales
combination
Difference of
quantity
Gross profit (4,416,238) (4,026,154) 1,009,370 (1,399,454)