Asus 2009 Annual Report Download - page 100
Download and view the complete annual report
Please find page 100 of the 2009 Asus annual report below. You can navigate through the pages in the report by either clicking on the pages listed below, or by using the keyword search tool below to find specific information within the annual report.-
 1
1 -
2
-
3
-
4
-
5
-
6
-
7
-
8
-
9
-
10
-
11
-
12
-
13
-
14
-
15
-
16
-
17
-
18
-
19
-
20
-
21
-
22
-
23
-
24
-
25
-
26
-
27
-
28
-
29
-
30
-
31
-
32
-
33
-
34
-
35
-
36
-
37
-
38
-
39
-
40
-
41
-
42
-
43
-
44
-
45
-
46
-
47
-
48
-
49
-
50
-
51
-
52
-
53
-
54
-
55
-
56
-
57
-
58
-
59
-
60
-
61
-
62
-
63
-
64
-
65
-
66
-
67
-
68
-
69
-
70
-
71
-
72
-
73
-
74
-
75
-
76
-
77
-
78
-
79
-
80
-
81
-
82
-
83
-
84
-
85
-
86
-
87
-
88
-
89
-
 90
90 -
 91
91 -
 92
92 -
 93
93 -
 94
94 -
 95
95 -
 96
96 -
 97
97 -
 98
98 -
 99
99 -
 100
100 -
 101
101 -
 102
102 -
 103
103 -
 104
104 -
 105
105 -
 106
106 -
 107
107 -
 108
108 -
 109
109 -
 110
110 -
111
-
112
-
113
-
114
-
115
-
116
-
117
-
118
-
119
-
120
-
121
-
122
-
123
-
124
-
125
-
126
-
127
-
128
-
129
-
130
-
131
-
132
-
133
-
134
-
135
-
136
-
137
-
138
-
139
-
140
-
141
-
142
-
143
-
144
-
145
-
146
-
147
-
148
-
149
-
150
-
151
-
152
-
153
-
154
-
155
-
156
-
157
-
158
-
159
-
160
-
161
-
162
-
163
-
164
-
165
-
166
-
167
-
168
-
169
-
170
-
171
-
172
-
173
-
174
-
175
-
176
-
177
-
178
-
179
-
180
-
181
-
182
-
183
-
184
-
185
-
186
-
187
-
188
-
189
-
190
-
191
-
192
-
193
-
194
-
195
-
196
-
197
-
198
-
199
-
200
-
201
-
202
-
203
-
204
-
205
-
206
-
207
-
208
-
209
-
210
-
211
-
212
-
213
-
214
-
215
-
216
-
217
-
218
-
219
-
220
-
221
-
222
-
223
-
224
-
225
-
226
-
227
-
228
-
229
-
230
-
231
-
232
-
233
-
234
-
235
-
236
-
237
-
238
-
239
 |
 |

96
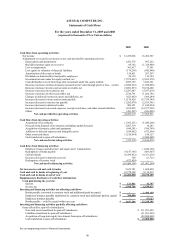
See accompanying notes to financial statements.
ASUSTeK COMPUTER INC.
Statements of Cash Flows
For the years ended December 31, 2009 and 2008
(expressed in thousands of New Taiwan dollars)
2009 2008
Cash flows from operating activities:
Net income $ 12,479,066 16,456,567
Adjustments to reconcile net income to net cash provided by operating activities:
Depreciation and amortization 1,432,376 897,252
Bad debt expenses (gain on recovery) 68,302 (1,329,486)
Loss on impairment 301,617 37,141
Loss (gain) on valuation of financial liabilities (179,298) (942,440)
Amortization of discount on bonds 128,051 267,507
Dividends on shares held in trust paid to employees 26,339 112,124
Investment income under the equity method, net (7,572,667) (9,039,978)
Cash dividends received from long-term investment under the equity method 4,987,395 3,822,301
Decrease (increase) in financial assets measured at fair value through profit or loss – current (4,880,632) (1,098,026)
Decrease (increase) in notes and accounts receivable, net (8,081,853) 70,194,420
Decrease (increase) in inventories, net 12,297,443 (5,937,618)
Decrease (increase) in other receivables, net 2,514,791 (1,260,781)
Changes in deferred income tax assets and liabilities, net (623,462) (369,244)
Increase (decrease) in notes and accounts payable 11,170,820 (35,759,549)
Increase (decrease) in income tax payable (1,282,878) (2,035,341)
Increase (decrease) in deferred credits 906,321 (1,010,034)
Increase (decrease) in accrued expenses, receipts in advance, and other current liabilities 1,239,095 (14,377,956)
Others (491,507) (941,026)
Net cash provided by operating activities 24,439,319 17,685,833
Cash flows from investing activities:
Acquisition of investments (1,365,251) (1,849,206)
Proceeds from disposal of investments (including capital decrease) 5,507,318 14,245
Acquisition of property, plant and equipment (648,281) (396,749)
Additions to deferred expenses and intangible assets (630,062) (972,896)
Other assets and others (3,218,894) 190,127
Cash transferred to spun-off subsidiaries - (2,000,000)
Net cash used in investing activities (355,170) (5,014,479)
Cash flows from financing activities:
Employee bonuses and directors’ and supervisors’ remuneration - (1,220,106)
Redemption of bonds payable (9,147,365) (483,807)
Cash dividends (8,439,852) (9,351,630)
Increase (decrease) in deposits received 308 (11,721)
Redemption of treasury stock (873,459) -
Net cash used in financing activities (18,460,368) (11,067,264)
Net increase in cash and cash in banks 5,623,781 1,604,090
Cash and cash in banks at beginning of year 10,778,309 9,174,219
Cash and cash in banks at end of year $ 16,402,090 10,778,309
Supplementary disclosures of cash flow information:
Cash paid during the year for:
Interest $ 121,861 42,787
Income tax $ 2,595,706 6,530,673
Investing and financing activities not affecting cash flows:
Bonds payable converted to common stock and additional paid-in capital $ - 1,484,149
Employee bonuses payable transferred to common stock and additional paid-in capital $ 700,000 -
Employee bonuses payable - 47,623
Bonds payable – could be repaid within one year $ 3,647,296 12,210,103
Investing and financing activities partially affecting cash flows:
Items affected by spin-off of subsidiaries:
Non-cash assets transferred to spun-off subsidiaries $ 111,851,499
Liabilities transferred to spun-off subsidiaries (31,851,499)
Acquisition of long-term equity investments from spun-off subsidiaries (82,000,000)
Cash transferred to spun-off subsidiaries $ (2,000,000)