Aflac 2008 Annual Report Download - page 99
Download and view the complete annual report
Please find page 99 of the 2008 Aflac annual report below. You can navigate through the pages in the report by either clicking on the pages listed below, or by using the keyword search tool below to find specific information within the annual report.-
 1
1 -
2
-
3
-
4
-
5
-
6
-
7
-
8
-
9
-
10
-
11
-
12
-
13
-
14
-
15
-
16
-
17
-
18
-
19
-
20
-
21
-
22
-
23
-
24
-
25
-
26
-
27
-
28
-
29
-
30
-
31
-
32
-
33
-
34
-
35
-
36
-
37
-
38
-
39
-
40
-
41
-
42
-
43
-
44
-
45
-
46
-
47
-
48
-
49
-
50
-
51
-
52
-
53
-
54
-
55
-
56
-
57
-
58
-
59
-
60
-
61
-
62
-
63
-
64
-
65
-
66
-
67
-
68
-
69
-
70
-
71
-
72
-
73
-
74
-
75
-
76
-
77
-
78
-
79
-
80
-
81
-
82
-
83
-
84
-
85
-
86
-
87
-
88
-
 89
89 -
 90
90 -
 91
91 -
 92
92 -
 93
93 -
 94
94 -
 95
95 -
 96
96 -
 97
97 -
 98
98 -
 99
99 -
 100
100 -
 101
101 -
 102
102
 |
 |

95
It’s no mystery how Aflac makes a difference.
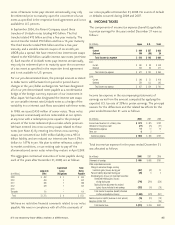
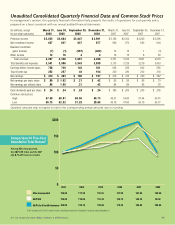
Unaudited Consolidated Quarterly Financial Data and Common Stock Prices
In management’s opinion, this quarterly financial information fairly presents the results of operations for such periods and is
prepared on a basis consistent with our annual audited financial statements.
(In millions, except March 31, June 30, September 30, December 31, March 31, June 30, September 30, December 31,
for per-share amounts) 2008 2008 2008 2008 2007 2007 2007 2007
Premium income $ 3,635 $ 3,684 $ 3,647 $ 3,981 $ 3,156 $ 3,162 $ 3,260 $ 3,395
Net investment income 627 637 637 677 566 572 592 604
Realized investment
gains (losses) (7) (1) (597) (402) 13 15 1 (1)
Other income 12 16 4 4 16 15 8 20
Total revenues 4,267 4,336 3,691 4,260 3,751 3,764 3,861 4,018
Total benefits and expenses 3,541 3,596 3,543 3,959 3,115 3,129 3,219 3,433
Earnings before income taxes 726 740 148 301 636 635 642 585
Total income tax 252 257 48 104 220 220 222 203
Net earnings $ 474 $ 483 $ 100 $ 197 $ 416 $ 415 $ 420 $ 382
Net earnings per basic share $ .99 $ 1.02 $ .21 $ .42 $ .85 $ .85 $ .86 $ .79
Net earnings per diluted share .98 1.00 .21 .42 .84 .84 .85 .78
Cash dividends paid per share $ .24 $ .24 $ .24 $ .24 $ .185 $ .205 $ .205 $ .205
Common stock prices:
High 67.00 68.81 68.00 60.73 49.37 54.00 57.44 63.91
Low 56.75 62.52 51.25 29.68 45.18 47.00 50.19 55.77
Quarterly amounts may not agree in total to the corresponding annual amounts due to rounding.
*$100 invested on 12/31/03 in stock or index, including reinvestment of dividends. Fiscal year ending December 31.
2003 2004 2005 2006 2007 2008
100.00 111.20 130.91 131.29 181.50 135.25
100.00 110.88 116.33 134.70 142.10 89.53
100.00 122.14 149.64 174.35 193.53 100.02
0
50
100
150
$200
S&P 500
Aflac Incorporated
S&P Life & Health Insurance
Comparison Of Five-Year
Cumulative Total Return*
Among Aflac Incorporated,
the S&P 500 Index and the S&P
Life & Health Insurance Index