Aflac 2008 Annual Report Download - page 46
Download and view the complete annual report
Please find page 46 of the 2008 Aflac annual report below. You can navigate through the pages in the report by either clicking on the pages listed below, or by using the keyword search tool below to find specific information within the annual report.-
 1
1 -
2
-
3
-
4
-
5
-
6
-
7
-
8
-
9
-
10
-
11
-
12
-
13
-
14
-
15
-
16
-
17
-
18
-
19
-
20
-
21
-
22
-
23
-
24
-
25
-
26
-
27
-
28
-
29
-
30
-
31
-
32
-
33
-
34
-
35
-
 36
36 -
 37
37 -
 38
38 -
 39
39 -
 40
40 -
 41
41 -
 42
42 -
 43
43 -
 44
44 -
 45
45 -
 46
46 -
 47
47 -
 48
48 -
 49
49 -
 50
50 -
 51
51 -
 52
52 -
 53
53 -
 54
54 -
 55
55 -
 56
56 -
57
-
58
-
59
-
60
-
61
-
62
-
63
-
64
-
65
-
66
-
67
-
68
-
69
-
70
-
71
-
72
-
73
-
74
-
75
-
76
-
77
-
78
-
79
-
80
-
81
-
82
-
83
-
84
-
85
-
86
-
87
-
88
-
89
-
90
-
91
-
92
-
93
-
94
-
95
-
96
-
97
-
98
-
99
-
100
-
101
-
102
 |
 |

42 Aflac Incorporated Annual Report for 2008
strengthened 25.4% relative to the U.S. dollar from the end of
2007 to the end of 2008.
We have investments in both publicly and privately issued
securities. The outstanding amount of a particular issuance,
as well as the level of activity in a particular issuance and
market conditions, including credit events and the interest
rate environment, affect liquidity regardless of whether it is
publicly or privately issued.
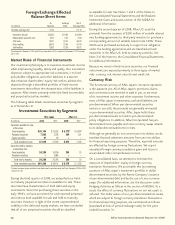
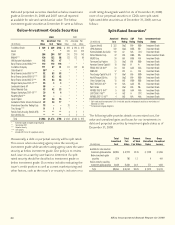
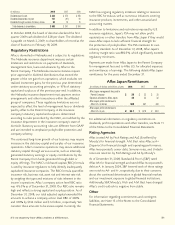
The following table details investment securities by type of
issuance as of December 31.
The following table details our privately issued investment
securities as of December 31.
Aflac Japan has invested in privately issued securities to secure
higher yields than those available on Japanese government
or other public corporate bonds. Aflac Japan’s investments in
yen-denominated privately issued securities consist primarily
of non-Japanese issuers and have longer maturities, thereby
allowing us to improve our asset/liability matching and our
overall investment returns. Most of our privately issued
securities are issued under medium-term note programs and
have standard documentation commensurate with credit
ratings, except when internal credit analysis indicates that
additional protective and/or event-risk covenants are required.
We use specific criteria to judge the credit quality of both
existing and prospective investments. Furthermore, we use
several methods to monitor these criteria, including credit
rating services and internal credit analysis. The distributions
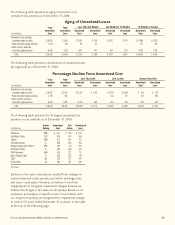
by credit rating of our purchases of debt securities for the
years ended December 31, based on acquisition cost, were as
follows:
The percentage increase of debt securities purchased in the
BBB rated category during the year was due to the attractive
relative value these securities presented while still meeting our
investment policy guidelines for liquidity, safety and quality.
The increased percentage of debt securities purchased in the
AAA rated category in 2007 primarily reflects the purchase of
U.S. Treasury bills by Aflac Japan prior to repatriating profits
to Aflac U.S. in the third quarter of 2007. We did not purchase
any perpetual securities during the periods presented in the
table above.
The distributions of debt and perpetual securities we own, by
credit rating, as of December 31 were as follows:
Although our investment portfolio continues to be of high
credit quality, many downgrades occurred during 2008, causing
a shift in composition by credit rating. The percentage of AA
rated securities decreased primarily as a result of downgrades
of certain banks and financial institutions investments and
CDO investments. The percentage of A rated securities
increased principally due to purchases and downgrades of
Composition of Purchases by
Credit Rating
2008 2007 2006
AAA 9.9% 18.4% 10.6%
AA 36.4 44.1 48.9
A 42.0 30.2 35.1
BBB 11.7 7.3 5.4
Total 100.0% 100.0% 100.0%
Composition by Credit Rating
2008 2007
Amortized Fair Amortized Fair
Cost Value Cost Value
AAA 5.7% 5.8% 6.3% 6.2%
AA 39.8 42.2 44.3 45.3
A 34.1 33.2 30.7 30.4
BBB 18.6 17.6 16.8 16.6
BB or lower 1.8 1.2 1.9 1.5
Total 100.0% 100.0% 100.0% 100.0%
Privately Issued Securities
(Amortized cost, in millions) 2008
2007
Privately issued securities as a percentage of total
debt and perpetual securities 72.0% 70.3%
Privately issued securities held by Aflac Japan $ 47,516 $ 35,973
Privately issued securities held by Aflac Japan as
a percentage of total debt and perpetual securities 68.3% 66.0%
Privately issued reverse-dual currency securities* $ 14,678 $ 11,185
Reverse-dual currency securities* as a percentage of total
privately issued securities 29.3% 29.2%
* Principal payments in yen and interest payment in dollars
Investment Securities by Type of Issuance
2008 2007
Amortized Fair Amortized Fair
(In millions) Cost Value Cost Value
Publicly issued securities:
Fixed maturities $ 19,292 $ 19,525 $ 15,986 $ 16,919
Perpetual securities 156 104 173 157
Equity securities 15 18 13 19
Total publicly issued 19,463 19,647 16,172 17,095
Privately issued securities:
Fixed maturities 41,178 38,571 30,232 29,783
Perpetual securities 8,918 7,943 8,079 7,866
Equity securities 9 9 8 9
Total privately issued 50,105 46,523 38,319 37,658
Total investment securities $ 69,568 $ 66,170 $ 54,491 $ 54,753