Aflac 2008 Annual Report Download - page 87
Download and view the complete annual report
Please find page 87 of the 2008 Aflac annual report below. You can navigate through the pages in the report by either clicking on the pages listed below, or by using the keyword search tool below to find specific information within the annual report.-
 1
1 -
2
-
3
-
4
-
5
-
6
-
7
-
8
-
9
-
10
-
11
-
12
-
13
-
14
-
15
-
16
-
17
-
18
-
19
-
20
-
21
-
22
-
23
-
24
-
25
-
26
-
27
-
28
-
29
-
30
-
31
-
32
-
33
-
34
-
35
-
36
-
37
-
38
-
39
-
40
-
41
-
42
-
43
-
44
-
45
-
46
-
47
-
48
-
49
-
50
-
51
-
52
-
53
-
54
-
55
-
56
-
57
-
58
-
59
-
60
-
61
-
62
-
63
-
64
-
65
-
66
-
67
-
68
-
69
-
70
-
71
-
72
-
73
-
74
-
75
-
76
-
 77
77 -
 78
78 -
 79
79 -
 80
80 -
 81
81 -
 82
82 -
 83
83 -
 84
84 -
 85
85 -
 86
86 -
 87
87 -
 88
88 -
 89
89 -
 90
90 -
 91
91 -
 92
92 -
 93
93 -
 94
94 -
 95
95 -
 96
96 -
 97
97 -
98
-
99
-
100
-
101
-
102
 |
 |

83
It’s no mystery how Aflac makes a difference.
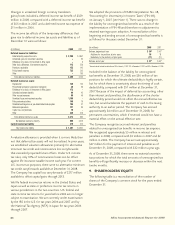
Fixed maturities and Equity
(In millions) perpetual securities securities Total
Balance, beginning of year $ 109 $ 3 $ 112
Realized gains (losses) included in earnings (57) – (57)
Unrealized gains (losses) included
in other comprehensive income (46) 1 (45)
Purchases and settlements 46 – 46
Transfers into Level 3 2,950 – 2,950
Balance, end of year $ 3,002 $ 4 $ 3,006
Amount of total gains (losses) for the year included in
earnings attributable to the change in unrealized gains
(losses) relating to assets still held at end of year $ (39) $ – $ (39)
Following the first quarter of 2008, we experienced a reduction
in the availability of observable valuation inputs from all of the
pricing services and brokers we use to value our investment
securities. Thus several valuation inputs we considered to
be observable in the first quarter of 2008 were classified as
non-observable in the second, third and fourth quarters of
2008. This resulted in the transfer of affected fixed maturities
available for sale from the Level 2 valuation category into the
Level 3 valuation category as shown in the table above.
As previously disclosed, we use various pricing sources,
including brokers and arrangers to provide pricing data or
valuation inputs for certain groups or classes of our securities.
To the extent that one or more of the significant valuation
inputs obtained from these sources is considered to be
unobservable or becomes unobservable and is used to value a
security, the estimated fair value for that security is considered
to be a Level 3 value. Consequently, those particular securities
are then classified as Level 3 valuations.
As a result of the continued contraction of observable
valuation inputs, we transferred investments totaling $2.7
billion into Level 3 during the fourth quarter of 2008.
Included in these transfers were our below-investment-grade
investments, callable RDC investments and certain of our
private placement securities. Transfers into Level 3 prior to the
fourth quarter totaled $245 million and consisted of various
other hard-to-value investment securities.
The significant valuation inputs that are used in the valuation
process for the below-investment-grade, callable RDC and
private placement investments classified as Level 3 include
forward exchange rates, yen swap rates, dollar swap rates,
interest rate volatilities, credit spread data on specific issuers,
assumed default and default recovery rates, certain probability
assumptions, and call option data.
Some of these securities require the calculation of a
theoretical forward exchange rate which is developed by using
yen swap rates, U.S. dollar swap rates, interest rate volatilities,
and spot exchange rates. The forward exchange rate is then
used to convert all future dollar cash flows of the bond, where
applicable, into yen cash flows. Additionally, credit spreads
for the individual issuers are key valuation inputs of these
securities. Finally, in pricing securities with a call option, the
assumptions regarding interest rates in the U.S. and Japan
are considered to be significant valuation inputs. Collectively,
these valuation inputs, are included to estimate the fair values
of these securities at each reporting date.
In obtaining the above valuation inputs, we have determined
that certain pricing assumptions and data used by our pricing
sources are becoming increasingly more difficult to validate
or corroborate by the market and/or appear to be internally
developed rather than observed in or corroborated by the
market. The use of these unobservable valuation inputs causes
more subjectivity in the valuation process for these securities
and consequently, causes more volatility in their estimated fair
values.
5. DEFERRED POLICY ACQUISITION COSTS AND
INSURANCE EXPENSES
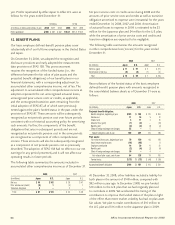
Deferred Policy Acquisition Costs and Insurance Expenses:
Consolidated policy acquisition costs deferred were $1.24
billion in 2008, compared with $1.09 billion in 2007 and $1.05
billion in 2006. The following table presents a rollforward of
deferred policy acquisition costs by segment for the years
ended December 31.
2008 2007
(In millions) Japan U.S. Japan U.S.
Deferred policy acquisition costs:
Balance, beginning of year $ 4,269 $ 2,385 $ 3,857 $ 2,168
Capitalization 658 578 555 539
Amortization (405) (370) (318) (322)
Foreign currency translation and other 1,122 – 175 –
Balance, end of year $ 5,644 $ 2,593 $ 4,269 $ 2,385
Commissions deferred as a percentage of total acquisition costs
deferred were 76% in 2008, 74% in 2007 and 76% in 2006.
Personnel, compensation and benefit expenses as a
percentage of insurance expenses were 43% in 2008 and 44%
in both 2007 and 2006. Advertising expense is reported as
incurred in insurance expenses in the consolidated statements
of earnings and was as follows for each of the three years
ended December 31:
(In millions) 2008 2007 2006
Advertising expense:
Aflac Japan $ 86 $ 83 $ 82
Aflac U.S. 118 95 88
Total advertising expense $ 204 $ 178 $ 170
Depreciation and other amortization expenses, which are
included in insurance expenses in the consolidated statements
of earnings for the years ended December 31, appear in the
table at the top of the following page.