Aflac 2008 Annual Report Download - page 71
Download and view the complete annual report
Please find page 71 of the 2008 Aflac annual report below. You can navigate through the pages in the report by either clicking on the pages listed below, or by using the keyword search tool below to find specific information within the annual report.-
 1
1 -
2
-
3
-
4
-
5
-
6
-
7
-
8
-
9
-
10
-
11
-
12
-
13
-
14
-
15
-
16
-
17
-
18
-
19
-
20
-
21
-
22
-
23
-
24
-
25
-
26
-
27
-
28
-
29
-
30
-
31
-
32
-
33
-
34
-
35
-
36
-
37
-
38
-
39
-
40
-
41
-
42
-
43
-
44
-
45
-
46
-
47
-
48
-
49
-
50
-
51
-
52
-
53
-
54
-
55
-
56
-
57
-
58
-
59
-
60
-
 61
61 -
 62
62 -
 63
63 -
 64
64 -
 65
65 -
 66
66 -
 67
67 -
 68
68 -
 69
69 -
 70
70 -
 71
71 -
 72
72 -
 73
73 -
 74
74 -
 75
75 -
 76
76 -
 77
77 -
 78
78 -
 79
79 -
 80
80 -
 81
81 -
82
-
83
-
84
-
85
-
86
-
87
-
88
-
89
-
90
-
91
-
92
-
93
-
94
-
95
-
96
-
97
-
98
-
99
-
100
-
101
-
102
 |
 |

67
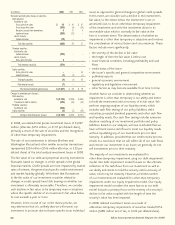
It’s no mystery how Aflac makes a difference.
Our investment discipline begins with a top-down approach
for each investment opportunity we consider. Consistent
with that approach, we first approve each country in which
we invest. In our approach to sovereign analysis, we consider
the political, legal and financial context of the sovereign
entity in which an issuer is domiciled and operates. Next we
approve the issuer’s industry sector, including such factors as
the stability of results and the importance of the sector to
the overall economy. Specific credit names within approved
countries and industry sectors are evaluated for their market
position and specific strengths and potential weaknesses.
Structures in which we invest are chosen for specific portfolio
management purposes, including asset/liability management,
portfolio diversification and net investment income.
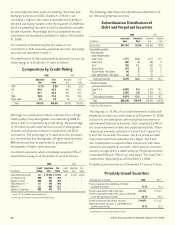
Our largest investment industry sector concentration is banks
and financial institutions. Within the countries we approve
for investment opportunities, we primarily invest in financial
institutions that are strategically crucial to each approved
country’s economy. The banks and financial institutions sector
is a highly regulated industry and plays a strategic role in the
global economy. We achieve some degree of diversification
in the banks and financial institutions sector through a
geographically diverse universe of credit exposures. Within this
sector, the more significant concentration of our credit risk by
geographic region or country of issuer at December 31, 2008,
based on amortized cost, was: Europe (48%); United States
(20%); United Kingdom (9%); and Japan (9%).
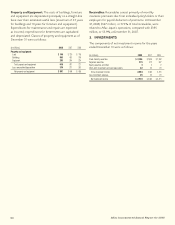
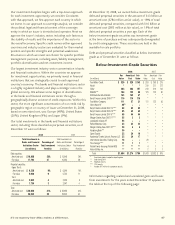
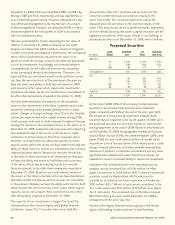
Our total investments in the banks and financial institutions
sector, including those classified as perpetual securities, as of
December 31 were as follows:
At December 31, 2008, we owned below-investment-grade
debt and perpetual securities in the amount of $1.3 billion at
amortized cost ($786 million at fair value), or 1.8% of total
debt and perpetual securities, compared with $1.0 billion at
amortized cost ($815 million at fair value), or 1.9% of total
debt and perpetual securities a year ago. Each of the
below-investment-grade securities was investment grade
at the time of purchase and was subsequently downgraded
by credit rating agencies. These securities are held in the
available-for-sale portfolio.
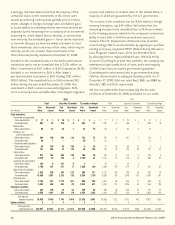
Debt and perpetual securities classified as below investment
grade as of December 31 were as follows:
Information regarding realized and unrealized gains and losses
from investments for the years ended December 31 appears in
the table at the top of the following page:
2008 2007
Total Investments in Total Investments in
Banks and Financial Percentage of Banks and Financial Percentage of
Institutions Sector Total Investment Institutions Sector Total Investment
(in millions) Portfolio (in millions) Portfolio
Debt securities:
Amortized cost $ 19,868 28% $ 15,948 29%
Fair value 17,793 27 15,563 28
Perpetual securities:
Upper Tier II:
Amortized cost $ 6,238 9% $ 5,549 10%
Fair value 5,960 9 5,732 11
Tier I:
Amortized cost 2,542 4 2,439 5
Fair value 1,780 3 2,047 4
Total:
Amortized cost $ 28,648 41% $ 23,936 44%
Fair value 25,533 39 23,342 43
Below-Investment-Grade Securities
2008 2007
Par Amortized Fair Par Amortized Fair
(In millions) Value Cost Value Value Cost Value
Ford Motor Credit $ 329 $ 329 $ 143 $ 263 $ 263 $ 215
Ahold * * * 310 311 272
CSAV 264 264 157 210 210 143
BAWAG*** 154 133 88 123 123 90
IKB Deutsche Industriebank 143 143 47 * * *
Beryl Finance Limited 2008-7**** 110 110 116 * * *
Ford Motor Company 111 57 31 111 122 93
Glitnir Bank HF 95(1) – – * * *
Beryl Finance Limited 2007-14**** 82 53 53 * * *
Beryl Finance Limited 2006-15**** 55 43 43 * * *
Beryl Finance Limited 2007-5**** 55 44 44 * * *
Morgan Stanley Aces 2007-21**** 55 3 3 * * *
Landsbanki Islands HF 55 – – * * *
Rinker Materials Corp. 43 42 23 * * *
Morgan Stanley Aces 2007-19**** 30 4 4 * * *
Kaupthing Bank*** 30 – – * * *
Sprint Capital 22 24 16 * * *
Academica Charter Schools Finance LLC 22 24 17 * * *
International Securities Trading Corp. 18 – – 20 – –
Tiers Georgia**** 11 1 1 * * *
Patrick Family Housing (Patrick AFB) ** ** ** 4 1 1
Aloha Utilities Inc. ** ** ** 2 2 1
Total $ 1,684 $ 1,274 $ 786 $ 1,043 $ 1,032 $ 815
* Investment grade at respective reporting date
** Sold during 2008
*** Perpetual security
**** CDO security
(1) Includes $55 million for a perpetual security