Aflac 2008 Annual Report Download - page 26
Download and view the complete annual report
Please find page 26 of the 2008 Aflac annual report below. You can navigate through the pages in the report by either clicking on the pages listed below, or by using the keyword search tool below to find specific information within the annual report.-
 1
1 -
2
-
3
-
4
-
5
-
6
-
7
-
8
-
9
-
10
-
11
-
12
-
13
-
14
-
15
-
 16
16 -
 17
17 -
 18
18 -
 19
19 -
 20
20 -
 21
21 -
 22
22 -
 23
23 -
 24
24 -
 25
25 -
 26
26 -
 27
27 -
 28
28 -
 29
29 -
 30
30 -
 31
31 -
 32
32 -
 33
33 -
 34
34 -
 35
35 -
 36
36 -
37
-
38
-
39
-
40
-
41
-
42
-
43
-
44
-
45
-
46
-
47
-
48
-
49
-
50
-
51
-
52
-
53
-
54
-
55
-
56
-
57
-
58
-
59
-
60
-
61
-
62
-
63
-
64
-
65
-
66
-
67
-
68
-
69
-
70
-
71
-
72
-
73
-
74
-
75
-
76
-
77
-
78
-
79
-
80
-
81
-
82
-
83
-
84
-
85
-
86
-
87
-
88
-
89
-
90
-
91
-
92
-
93
-
94
-
95
-
96
-
97
-
98
-
99
-
100
-
101
-
102
 |
 |

22 Aflac Incorporated Annual Report for 2008
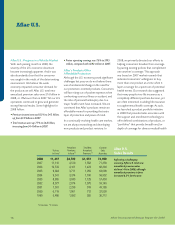
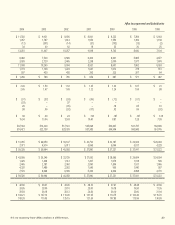
For the Year (In millions, except for share and per-share amounts) 2008 2007 2006 2005
Revenues:
Premiums, principally supplemental health insurance $ 14,947 $ 12,973 $ 12,314 $ 11,990
Net investment income 2,578 2,333 2,171 2,071
Realized investment gains (losses) (1,007) 28 79 262
Other income 36 59 52 40
Total revenues 16,554 15,393 14,616 14,363
Benefits and expenses:
Benefits and claims 10,499 9,285 9,016 8,890
Expenses 4,141 3,609 3,336 3,247
Total benefits and expenses 14,640 12,894 12,352 12,137
Pretax earnings 1,914 2,499 2,264 2,226
Income taxes 660 865 781 743
Net earnings $ 1,254 $ 1,634 $ 1,483 $ 1,483
Per-Share and Share Amounts
Net earnings (basic) $ 2.65 $ 3.35 $ 2.99 $ 2.96
Net earnings (diluted) 2.62 3.31 2.95 2.92
Items impacting net earnings per diluted share, net of tax:
Realized investment gains (losses) $ (1.37) $ .04 $ .10 $ .33
Impact from SFAS 133 – – – (.02)
Nonrecurring items – – – .07
Foreign currency translation* .23 (.02) (.08) (.02)
Cash dividends paid $ .96 $ .80 $ .55 $ .44
Shareholders’ equity 14.23 18.08 16.93 15.89
Common shares used to calculate basic EPS (In thousands) 473,405 487,869 495,614 500,939
Common shares used to calculate diluted EPS (In thousands) 478,815 493,971 501,827 507,704
At Year-end
Assets:
Investments and cash $ 68,550 $ 57,056 $ 51,972 $ 48,989
Other 10,781 8,749 7,833 7,372
Total assets $ 79,331 $ 65,805 $ 59,805 $ 56,361
Liabilities and shareholders’ equity:
Policy liabilities $ 66,219 $ 50,676 $ 45,440 $ 42,329
Notes payable 1,721 1,465 1,426 1,395
Income taxes 1,201 2,531 2,462 2,577
Other liabilities 3,551 2,338 2,136 2,133
Shareholders’ equity 6,639 8,795 8,341 7,927
Total liabilities and shareholders’ equity $ 79,331 $ 65,805 $ 59,805 $ 56,361
Supplemental Data
Stock price range: High $ 68.81 $ 63.91 $ 49.40 $ 49.65
Low 29.68 45.18 41.63 35.50
Close 45.84 62.63 46.00 46.42
Yen/dollar exchange rate at year-end ¥ 91.03 ¥ 114.15 ¥ 119.11 ¥ 118.07
Weighted-average yen/dollar exchange rate for the year 103.46 117.93 116.31 109.88
*Translation effect on Aflac Japan segment and Parent Company yen-denominated interest expense
Amounts in 2001 through 2004 have been adjusted for adoption of SFAS 123R on January 1, 2005.
Selected Financial Data