Aflac 2008 Annual Report Download - page 31
Download and view the complete annual report
Please find page 31 of the 2008 Aflac annual report below. You can navigate through the pages in the report by either clicking on the pages listed below, or by using the keyword search tool below to find specific information within the annual report.-
 1
1 -
2
-
3
-
4
-
5
-
6
-
7
-
8
-
9
-
10
-
11
-
12
-
13
-
14
-
15
-
16
-
17
-
18
-
19
-
20
-
 21
21 -
 22
22 -
 23
23 -
 24
24 -
 25
25 -
 26
26 -
 27
27 -
 28
28 -
 29
29 -
 30
30 -
 31
31 -
 32
32 -
 33
33 -
 34
34 -
 35
35 -
 36
36 -
 37
37 -
 38
38 -
 39
39 -
 40
40 -
 41
41 -
42
-
43
-
44
-
45
-
46
-
47
-
48
-
49
-
50
-
51
-
52
-
53
-
54
-
55
-
56
-
57
-
58
-
59
-
60
-
61
-
62
-
63
-
64
-
65
-
66
-
67
-
68
-
69
-
70
-
71
-
72
-
73
-
74
-
75
-
76
-
77
-
78
-
79
-
80
-
81
-
82
-
83
-
84
-
85
-
86
-
87
-
88
-
89
-
90
-
91
-
92
-
93
-
94
-
95
-
96
-
97
-
98
-
99
-
100
-
101
-
102
 |
 |

27
It’s no mystery how Aflac makes a difference.
factor method because the actual cash payments to date for
claims 13 or more months old are deemed to have sufficient
credibility on which to base the remaining liability estimate.
Prior to the 13th month, the historical claim cost method is
deemed to have more credibility. The difference in estimate
between the two methods is routinely recognized in our
financial statements in the 13th month after a claim is incurred.
For the past several years, we have experienced a downward
trend in our current period hospitalization claim costs,
primarily in Japan. For this reason, our claim cost estimate as
of December 31, 2006, was high. Redundancy or insufficiency
is initially recognized when the claims reach the thirteenth
month after incurral. More than 75% of the 2007 release of
prior period claim liability was related to claims incurred in
2006. The remainder was related to claims incurred prior to
2006.
In computing the estimate of unpaid policy claims, we
consider many factors, including the benefits and amounts
available under the policy; the volume and demographics
of the policies exposed to claims; and internal business
practices, such as incurred date assignment and current claim
administrative practices. We monitor these conditions closely
and make adjustments to the liability as actual experience
emerges. Claim levels are generally stable from period to
period; however, fluctuations in claim levels may occur. In
calculating the unpaid policy claim liability, we do not calculate
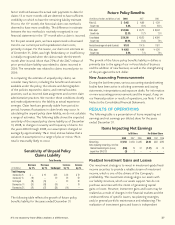
a range of estimates. The following table shows the expected
sensitivity of the unpaid policy claims liability as of December
31, 2008, to changes in severity and frequency of claims. For
the years 2006 through 2008, our assumptions changed on
average by approximately 1% in total, and we believe that a
variation in assumptions in a range of plus or minus 1% in
total is reasonably likely to occur.
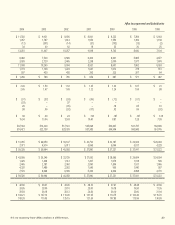
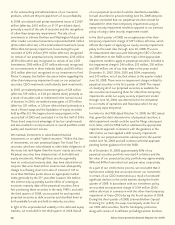
The following table reflects the growth of future policy
benefits liability for the years ended December 31.
The growth of the future policy benefits liability in dollars is
primarily due to the aging of our in-force block of business
and the addition of new business, as well as the strengthening
of the yen against the U.S. dollar.
New Accounting Pronouncements
During the last three years, various accounting standard-setting
bodies have been active in soliciting comments and issuing
statements, interpretations and exposure drafts. For information
on new accounting pronouncements and the impact, if any, on
our financial position or results of operations, see Note 1 of the
Notes to the Consolidated Financial Statements.
RESULTS OF OPERATIONS
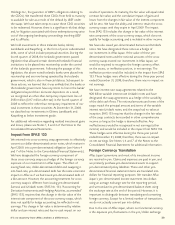
The following table is a presentation of items impacting net
earnings and net earnings per diluted share for the years
ended December 31.
Realized Investment Gains and Losses
Our investment strategy is to invest in investment-grade fixed-
income securities to provide a reliable stream of investment
income, which is one of the drivers of the Company’s
profitability. This investment strategy aligns our assets with
our liability structure, which our assets support. We do not
purchase securities with the intent of generating capital
gains or losses. However, investment gains and losses may be
realized as a result of changes in the financial markets and the
creditworthiness of specific issuers, tax planning strategies,
and/or general portfolio maintenance and rebalancing. The
realization of investment gains and losses is independent
Sensitivity of Unpaid Policy
Claims Liability
Total Severity
Decrease Decrease Increase Increase
(In millions) by 2% by 1% Unchanged by 1% by 2%
Total Frequency
Increase by 2% $ – $ 19 $ 39 $ 59 $ 79
Increase by 1% (19) – 20 39 59
Unchanged (38) (19) – 20 39
Decrease by 1% (57) (38) (19) – 19
Decrease by 2% (76) (57) (38) (19) –
Future Policy Benefits
(In millions of dollars and billions of yen) 2008 2007
2006
Aflac U.S. $ 5,442 $ 4,958 $ 4,391
Growth rate 9.8% 12.9% 16.2%
Aflac Japan $ 53,866 $ 40,715 $ 36,447
Growth rate 32.3% 11.7% 7.0%
Consolidated $ 59,310 $ 45,675 $ 40,841
Growth rate 29.9% 11.8% 7.9%
Yen/dollar exchange rate (end of period) 91.03 114.15 119.11
Aflac Japan ¥ 4,903 ¥ 4,648 ¥ 4,341
Growth rate 5.5% 7.1% 7.9%
Items Impacting Net Earnings
In Millions Per Diluted Share
2008 2007 2006 2008 2007 2006
Net earnings $1,254 $1,634 $1,483 $2.62 $3.31 $2.95
Items impacting net earnings, net of tax:
Realized investment gains (losses) (655) 19 51 (1.37) .04 .10
Impact from SFAS 133 (3) 2 – – – –