Aflac 2008 Annual Report Download - page 51
Download and view the complete annual report
Please find page 51 of the 2008 Aflac annual report below. You can navigate through the pages in the report by either clicking on the pages listed below, or by using the keyword search tool below to find specific information within the annual report.-
 1
1 -
2
-
3
-
4
-
5
-
6
-
7
-
8
-
9
-
10
-
11
-
12
-
13
-
14
-
15
-
16
-
17
-
18
-
19
-
20
-
21
-
22
-
23
-
24
-
25
-
26
-
27
-
28
-
29
-
30
-
31
-
32
-
33
-
34
-
35
-
36
-
37
-
38
-
39
-
40
-
 41
41 -
 42
42 -
 43
43 -
 44
44 -
 45
45 -
 46
46 -
 47
47 -
 48
48 -
 49
49 -
 50
50 -
 51
51 -
 52
52 -
 53
53 -
 54
54 -
 55
55 -
 56
56 -
 57
57 -
 58
58 -
 59
59 -
 60
60 -
 61
61 -
62
-
63
-
64
-
65
-
66
-
67
-
68
-
69
-
70
-
71
-
72
-
73
-
74
-
75
-
76
-
77
-
78
-
79
-
80
-
81
-
82
-
83
-
84
-
85
-
86
-
87
-
88
-
89
-
90
-
91
-
92
-
93
-
94
-
95
-
96
-
97
-
98
-
99
-
100
-
101
-
102
 |
 |

47
It’s no mystery how Aflac makes a difference.
used to convert all future dollar cash flows of the bond, where
applicable, into yen cash flows. Additionally, credit spreads
for the individual issuers are key valuation inputs for these
securities. Finally, in pricing securities with a call option, the
assumptions regarding interest rates in the U.S. and Japan
are considered to be significant valuation inputs. Collectively,
these valuation inputs, are used to estimate the fair values of
these securities at each reporting date.
In obtaining the above valuation inputs, we have determined
that certain pricing assumptions and data used by our pricing
sources are becoming increasingly more difficult to validate
or corroborate by the market and/or appear to be internally
developed rather than observed in or corroborated by the
market. The use of these unobservable valuation inputs causes
more subjectivity in the valuation process for these securities
and, consequently, causes more volatility in their estimated fair
values.
We estimate the fair values of our securities available for sale
on a monthly basis. We monitor the estimated fair values from
each of the sources described above for consistency from
month to month and based on current market conditions. We
also periodically discuss with our custodian and pricing brokers
the pricing techniques they use to monitor the consistency
of their approach and periodically assess the appropriateness
of the valuation level assigned to the values obtained from
them. See Note 4 of the Notes to the Consolidated Financial
Statements for the classification of our securities available for
sale under the provisions of SFAS 157 as of December 31, 2008.
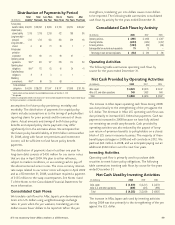
Cash, cash equivalents and short-term investments totaled $.9
billion, or 1.4% of total investments and cash, as of December
31, 2008, compared with $1.6 billion, or 2.7%, at December
31, 2007. For a discussion of the factors causing the change
in our cash balance, see the Operating Activities, Investing
Activities and Financing Activities sections of this MD&A.
For additional information concerning our investments, see
Notes 3 and 4 of the Notes to the Consolidated Financial
Statements.
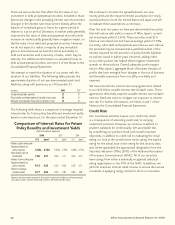
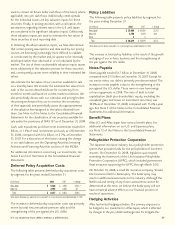
Deferred Policy Acquisition Costs
The following table presents deferred policy acquisition costs
by segment for the years ended December 31.
The increase in deferred policy acquisition costs was primarily
driven by total new annualized premium sales and the
strengthening of the yen against the U.S. dollar.
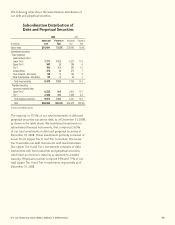
Policy Liabilities
The following table presents policy liabilities by segment for
the years ending December 31.
The increase in total policy liabilities is the result of the growth
and aging of our in-force business and the strengthening of
the yen against the U.S. dollar.
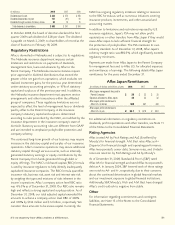
Notes Payable
Notes payable totaled $1.7 billion at December 31, 2008,
compared with $1.5 billion at December 31, 2007. Except for
our senior notes, our debt is primarily yen-denominated. The
increase in notes payable is due to the strengthening of the
yen against the U.S. dollar. There were no new borrowings
or loan repayments in 2008. The ratio of debt to total
capitalization (debt plus shareholders’ equity, excluding the
unrealized gains and losses on investment securities) was
18.0% as of December 31, 2008, compared with 15.6% a year
ago. See Note 7 of the Notes to the Consolidated Financial
Statements for additional information.
Benefit Plans
Aflac U.S. and Aflac Japan have various benefit plans. For
additional information on our U.S. and Japanese plans,
see Note 12 of the Notes to the Consolidated Financial
Statements.
Policyholder Protection Corporation
The Japanese insurance industry has a policyholder protection
system that provides funds for the policyholders of insolvent
insurers. On December 12, 2008, legislation was enacted
extending the framework of the Life Insurance Policyholder
Protection Corporation (LIPPC), which included government
fiscal measures supporting the LIPPC through March 2012.
On October 10, 2008, a small life insurance company, Yamato
Life Insurance filed for bankruptcy. The bankruptcy may
result in additional assessments to the industry. Although the
likelihood and timing of any future assessments cannot be
determined at this time, we believe the bankruptcy will not
have a material adverse effect on our financial position or
results of operations.
Hedging Activities
Aflac has limited hedging activities. Our primary exposure to
be hedged is our investment in Aflac Japan, which is affected
by changes in the yen/dollar exchange rate. To mitigate this
(In millions)
2008
2007 % change
Aflac Japan $ 5,644 $ 4,269 32.2%*
Aflac U.S. 2,593 2,385 8.7
Total $ 8,237 $ 6,654 23.8%
*Aflac Japan’s deferred policy acquisition costs increased 5.4% in yen during the year ended December 31, 2008.
(In millions)
2008
2007 % change
Aflac Japan $ 59,466 $ 44,694 33.1%*
Aflac U.S. 6,750 5,979 12.9
Other 3 3 –
Total $ 66,219 $ 50,676 30.7%
*Aflac Japan’s policy liabilities increased 6.1% in yen during the year ended December 31, 2008.