Aflac 2008 Annual Report Download - page 70
Download and view the complete annual report
Please find page 70 of the 2008 Aflac annual report below. You can navigate through the pages in the report by either clicking on the pages listed below, or by using the keyword search tool below to find specific information within the annual report.-
 1
1 -
2
-
3
-
4
-
5
-
6
-
7
-
8
-
9
-
10
-
11
-
12
-
13
-
14
-
15
-
16
-
17
-
18
-
19
-
20
-
21
-
22
-
23
-
24
-
25
-
26
-
27
-
28
-
29
-
30
-
31
-
32
-
33
-
34
-
35
-
36
-
37
-
38
-
39
-
40
-
41
-
42
-
43
-
44
-
45
-
46
-
47
-
48
-
49
-
50
-
51
-
52
-
53
-
54
-
55
-
56
-
57
-
58
-
59
-
 60
60 -
 61
61 -
 62
62 -
 63
63 -
 64
64 -
 65
65 -
 66
66 -
 67
67 -
 68
68 -
 69
69 -
 70
70 -
 71
71 -
 72
72 -
 73
73 -
 74
74 -
 75
75 -
 76
76 -
 77
77 -
 78
78 -
 79
79 -
 80
80 -
81
-
82
-
83
-
84
-
85
-
86
-
87
-
88
-
89
-
90
-
91
-
92
-
93
-
94
-
95
-
96
-
97
-
98
-
99
-
100
-
101
-
102
 |
 |

66 Aflac Incorporated Annual Report for 2008
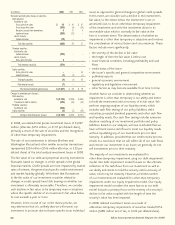
As more fully described under the heading “Securities and
Exchange Commission (SEC) Guidance” in Note 1, we
concluded, in light of the recent unprecedented volatility in
the debt and equity markets in the third quarter of 2008 that
all of our perpetual securities should be classified as available-
for-sale securities. Accordingly, all of our perpetual security
investments are classified as available for sale as of December
31, 2008.
The methods of determining the fair values of our
investments in debt securities, perpetual securities and equity
securities are described in Note 4.
The distributions of debt and perpetual securities we own, by
credit rating, as of December 31 were as follows:
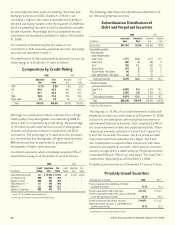
Although our investment portfolio continues to be of high
credit quality, many downgrades occurred during 2008 to
cause a shift in composition by credit rating. The percentage
of AA rated securities decreased as a result of downgrades
of banks and financial institutions investments and CDO
investments. The percentage of A rated securities increased
due to purchases and downgrades of higher rated securities.
BBB rated securities increased due to purchases and
downgrades of higher rated securities.
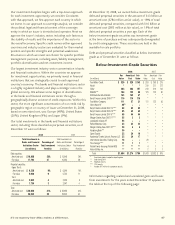
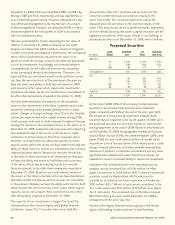
Investment exposures, which individually exceeded 10% of
shareholders’ equity as of December 31, were as follows:
2008 2007
Credit Amortized Fair Credit Amortized Fair
(In millions) Rating Cost Value Rating Cost Value
Japan National Government AA $ 10,604 $ 11,533 AA $ 8,000 $ 8,583
Israel Electric Corp. BBB 902 902 * * *
Republic of Tunisia BBB 880 909 * * *
HSBC Holdings PLC ** AA 856 860 * * *
HBOS PLC** AA 686 611 * * *
Republic of South Africa BBB 674 727 * * *
* Less than 10% of shareholders’ equity at reporting date
** For this issuer, we own more than one security with different ratings.
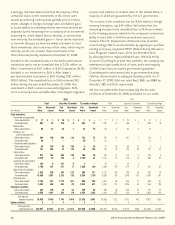
The following table shows the subordination distribution of
our debt and perpetual securities.
The majority, or 73.5%, of our total investments in debt and
perpetual securities was senior debt as of December 31, 2008,
as shown in the table above. We maintained investments in
subordinated financial instruments, that comprised 26.5% of
our total investments in debt and perpetual securities. These
investments primarily consisted of Lower Tier II, Upper Tier
II, and Tier I securities. The Lower Tier II securities are debt
instruments with fixed maturities. Our Upper Tier II and
Tier I investments consisted of debt instruments with fixed
maturities and perpetual securities, which have an economic
maturity as opposed to a stated maturity. Perpetual securities
comprised 95% and 77% of our total Upper Tier II and Tier I
investments, respectively, as of December 31, 2008.
Privately issued securities as of December 31 were as follows:
Privately Issued Securities
(Amortized cost, in millions) 2008 2007
Privately issued securities as percentage of total debt
and perpetual securities 72.0% 70.3%
Privately issued securities held by Aflac Japan $ 47,516 $ 35,973
Privately issued securities held by Aflac Japan as a percentage
of total debt and perpetual securities 68.3% 66.0%
Privately issued reverse-dual currency securities* $ 14,678 $ 11,185
Reverse-dual currency securities* as a percentage of total
privately issued securities 29.3% 29.2%
*Principal payments in yen and interest payments in dollars
Composition by Credit Rating
2008 2007
Amortized Fair Amortized Fair
Cost Value Cost Value
AAA 5.7% 5.8% 6.3% 6.2%
AA 39.8 42.2 44.3 45.3
A 34.1 33.2 30.7 30.4
BBB 18.6 17.6 16.8 16.6
BB or lower 1.8 1.2 1.9 1.5
Total 100.0% 100.0% 100.0% 100.0%
Subordination Distribution of
Debt and Perpetual Securities
2008
2007
Amortized Percent of Amortized Percent of
(In millions) Cost Total Cost Total
Senior notes $ 51,091 73.5% $ 38,483 70.6%
Subordinated securities:
Fixed maturities
(stated maturity date):
Lower Tier II 7,777 11.2 6,277 11.5
Upper Tier II 340 .5 296 .6
Tier I* 750 1.1 582 1.0
Surplus Notes 374 .5 375 .7
Trust Preferred - Non-banks 86 .1 154 .3
Other Subordinated - Non-banks 52 .1 52 .1
Total fixed maturities 9,379 13.5 7,736 14.2
Perpetual securities
(economic maturity date):
Upper Tier II 6,532 9.4 5,812 10.7
Tier I 2,542 3.6 2,439 4.5
Total perpetual securities 9,074 13.0 8,251 15.2
Total $ 69,544 100.0% $ 54,470 100.0%
* Includes Trust Preferred securities