Aflac 2008 Annual Report Download - page 45
Download and view the complete annual report
Please find page 45 of the 2008 Aflac annual report below. You can navigate through the pages in the report by either clicking on the pages listed below, or by using the keyword search tool below to find specific information within the annual report.-
 1
1 -
2
-
3
-
4
-
5
-
6
-
7
-
8
-
9
-
10
-
11
-
12
-
13
-
14
-
15
-
16
-
17
-
18
-
19
-
20
-
21
-
22
-
23
-
24
-
25
-
26
-
27
-
28
-
29
-
30
-
31
-
32
-
33
-
34
-
 35
35 -
 36
36 -
 37
37 -
 38
38 -
 39
39 -
 40
40 -
 41
41 -
 42
42 -
 43
43 -
 44
44 -
 45
45 -
 46
46 -
 47
47 -
 48
48 -
 49
49 -
 50
50 -
 51
51 -
 52
52 -
 53
53 -
 54
54 -
 55
55 -
56
-
57
-
58
-
59
-
60
-
61
-
62
-
63
-
64
-
65
-
66
-
67
-
68
-
69
-
70
-
71
-
72
-
73
-
74
-
75
-
76
-
77
-
78
-
79
-
80
-
81
-
82
-
83
-
84
-
85
-
86
-
87
-
88
-
89
-
90
-
91
-
92
-
93
-
94
-
95
-
96
-
97
-
98
-
99
-
100
-
101
-
102
 |
 |

41
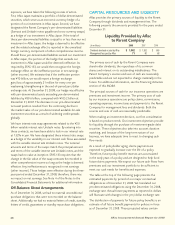
It’s no mystery how Aflac makes a difference.
The methods of determining the fair values of our
investments in debt securities, perpetual securities and
equity securities are described in Note 4 of the Notes to the
Consolidated Financial Statements.
Our investment discipline begins with a top-down approach
for each investment opportunity we consider. Consistent
with that approach, we first approve each country in which
we invest. In our approach to sovereign analysis, we consider
the political, legal and financial context of the sovereign
entity in which an issuer is domiciled and operates. Next we
approve the issuer’s industry sector, including such factors as
the stability of results and the importance of the sector to
the overall economy. Specific credit names within approved
countries and industry sectors are evaluated for their market
position and specific strengths and potential weaknesses.
Structures in which we invest are chosen for specific portfolio
management purposes, including asset/liability management,
portfolio diversification and net investment income.
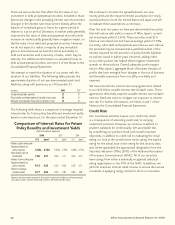
Our largest investment industry sector concentration is banks
and financial institutions. Within the countries we approve
for investment opportunities, we primarily invest in financial
institutions that are strategically crucial to each approved
country’s economy. The banks and financial institutions sector
is a highly regulated industry and plays a strategic role in the
global economy. We achieve some degree of diversification
in the banks and financial institutions sector through a
geographically diverse universe of credit exposures. Within this
sector, the more significant concentration of our credit risk by
geographic region or country of issuer at December 31, 2008,
based on amortized cost, was: Europe (48%); United States
(20%); United Kingdom (9%); and Japan (9%).
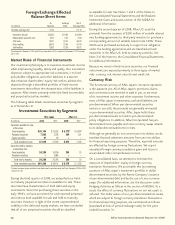
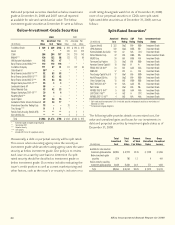
Our total investments in the banks and financial institutions
sector, including those classified as perpetual securities, as of
December 31 were as follows:
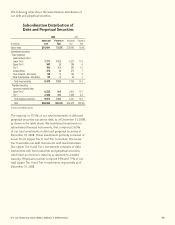
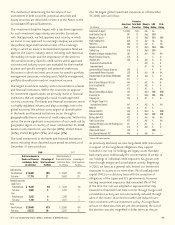
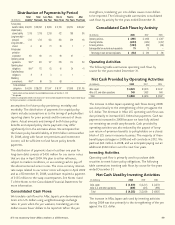
Our 30 largest global investment exposures as of December
31, 2008, were as follows:
As previously disclosed, we own long-dated debt instruments
in support of the long-dated obligations they support.
Included in our top 30 holdings are legacy issues that date
back many years. Additionally, the concentration of certain of
our holdings of individual credit exposures has grown over
time through merger and consolidation activity. Beginning
in 2005, we have, as a general rule, limited our investment
exposures to issuers to no more than 5% of total adjusted
capital (TAC) on a statutory basis with the exception of
obligations of the Japan and U.S. governments. However,
existing investment exposures that exceeded 5% of TAC
at the time this rule was adopted or exposures that may
exceed this threshold from time to time through merger and
consolidation activity are not automatically reduced through
sales of the issuers’ securities but rather are reduced over
time consistent with our investment policy. As a significant
amount of these securities are yen-denominated, the size of
the position was also magnified in dollar terms as the yen
2008 2007
Total Investments in Total Investments in
Banks and Financial Percentage of Banks and Financial Percentage of
Institutions Sector Total Investment Institutions Sector Total Investment
(in millions) Portfolio (in millions) Portfolio
Debt securities:
Amortized cost $ 19,868 28% $ 15,948 29%
Fair value 17,793 27 15,563 28
Perpetual securities:
Upper Tier II:
Amortized cost $ 6,238 9% $ 5,549 10%
Fair value 5,960 9 5,732 11
Tier I:
Amortized cost 2,542 4 2,439 5
Fair value 1,780 3 2,047 4
Total:
Amortized cost $ 28,648 41% $ 23,936 44%
Fair value 25,533 39 23,342 43
Percent of
Amortized Total Debt Moody’s S&P Fitch
(In millions) Cost Securities Rating Rating Rating
Government of Japan* $ 10,604 15.3% Aa3 AA –
Israel Electric Corp Ltd. 901 1.3 Baa2 BBB+ –
Republic of Tunisia 879 1.3 Baa2 BBB BBB
HSBC Holdings PLC 856 1.2 Aa2 AA- AA
HBOS PLC 686 1.0 Aa2 A+ AA
Republic of South Africa 674 1.0 Baa1 BBB+ BBB+
Takefuji Corp 616 .9 Baa1 BBB- –
Kingdom of Belgium (includes Fortis) 583 .8 Aa1 AA+ AA+
Mizuho Financial Group Inc. 570 .8 – A A+
Unicredit SPA 558 .8 Aa3 A+ A+
Bank Austria Creditanstalt AG – – Aa2 A+ A
Hypovereinsbank – – A1 A+ A
Sumitomo Mitsui Financial Group Inc. 549 .8 – A A+
Commonwealth Bank of Australia 538 .8 Aa1 AA AA
Dresdner Bank AG (An Allianz AG Member) 524 .8 Aa3 A A+
Dexia SA 511 .7 – – AA-
Bank of Tokyo-Mitsubishi UFJ Ltd. 494 .7 Aa2 A+ A+
Erste Group Bank AG 471 .7 Aa3 A A
Metlife Inc. 470 .7 A2 A A
Mexico (United Mexican States) 455 .7 Baa1 BBB+ BBB+
Investcorp SA 451 .7 Baa3 BBB BBB
Citigroup Inc. 444 .6 A2 A A+
J.P. Morgan Chase & Co.
(includes Bear Stearns) 442 .6 Aa2 A+ AA-
BMW AG 439 .6 A2 A –
National Grid PLC 439 .6 Baa1 A- BBB+
Telecom Italia SPA 439 .6 Baa2 BBB BBB
Barclays Bank PLC 432 .6 Aa1 AA- AA
Credit Suisse Group 422 .6 Aa2 A AA-
Hutchison Whampoa Ltd. (CKI Holdings Ltd.) 421 .6 A3 A- A-
Swedbank AB 410 .6 Aa3 A A+
Unique Zurich Airport 406 .6 – BBB+ –
Irish Life and Permanent PLC 406 .6 Aa3 A- –
* JGBs or JGB-backed securities