Aflac 2008 Annual Report Download - page 92
Download and view the complete annual report
Please find page 92 of the 2008 Aflac annual report below. You can navigate through the pages in the report by either clicking on the pages listed below, or by using the keyword search tool below to find specific information within the annual report.
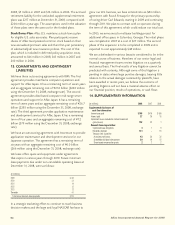
88 Aflac Incorporated Annual Report for 2008
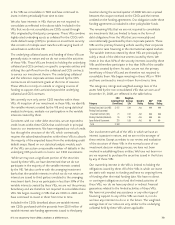
Share-based awards granted to U.S.-based grantees are settled
upon exercise with authorized but unissued Company stock,
while those issued to Japan-based grantees are settled upon
exercise with treasury shares.
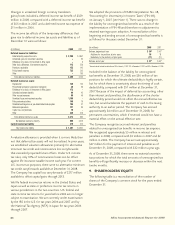
The following table presents the expense recognized in
connection with share-based awards for the periods ended
December 31.
(In millions, except for per-share amounts) 2008 2007 2006
Earnings from continuing operations $ 42 $ 42 $ 35
Earnings before income taxes 42 42 35
Net earnings 29 29 25
Net earnings per share:
Basic $ .06 $ .06 $ .05
Diluted .06 .06 .05
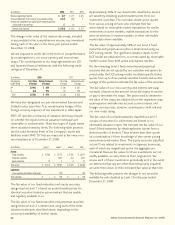
We estimate the fair value of each stock option granted
using the Black-Scholes-Merton multiple option approach.
Expected volatility is based on historical periods generally
commensurate with the estimated term of options. We use
historical data to estimate option exercise and termination
patterns within the model. Separate groups of employees
that have similar historical exercise patterns are stratified and
considered separately for valuation purposes. The expected
term of options granted is derived from the output of our
option model and represents the weighted-average period of
time that options granted are expected to be outstanding. We
base the risk-free interest rate on the Treasury note rate with
a term comparable to that of the estimated term of options.
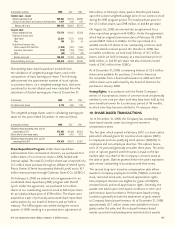
The weighted-average fair value of options at their grant date
was $17.21 for 2008, compared with $16.06 for 2007 and
$15.28 in 2006. The following table presents the assumptions
used in valuing options granted during the years ended
December 31.
2008 2007 2006
Expected term (years) 7.0 7.4 6.7
Expected volatility 25.0% 25.0% 28.0%
Annual forfeiture rate .8 .8 .8
Risk-free interest rate 3.5 4.7 4.5
Dividend yield 1.3 1.3 1.1
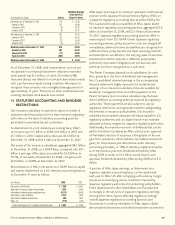
The following table summarizes stock option activity.
Stock Option Weighted-Average
(In thousands of shares) Shares Exercise Price Per Share
Outstanding at December 31, 2005 19,981 $ 27.40
Granted in 2006 2,456 45.08
Canceled in 2006 (90) 39.72
Exercised in 2006 (2,241) 18.61
Outstanding at December 31, 2006 20,106 30.48
Granted in 2007 1,244 49.35
Canceled in 2007 (133) 43.64
Exercised in 2007 (4,640) 20.94
Outstanding at December 31, 2007 16,577 34.46
Granted in 2008 1,703 59.78
Canceled in 2008 (146) 44.69
Exercised in 2008 (1,798) 25.91
Outstanding at December 31, 2008 16,336 $ 37.95
(In thousands of shares) 2008 2007 2006
Shares exercisable, end of year 12,382 12,653 16,094
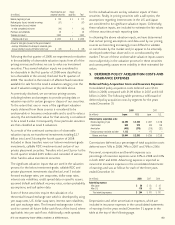
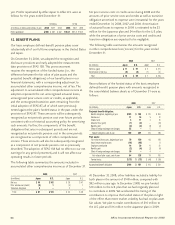
The following table summarizes information about stock
options outstanding and exercisable at December 31, 2008.
(In thousands of shares) Options Outstanding Options Exercisable
Stock Wgtd.-Avg. Weighted- Stock Weighted-
Range of Option Remaining Average Option Average
Exercise Prices Shares Contractual Exercise Shares Exercise
Per Share Outstanding Life (Yrs.) Price Per Share Exercisable Price Per Share
$ 21.16 – $ 23.87 2,587 1.4 $ 23.10 2,587 $ 23.10
24.00 – 30.38 2,291 2.5 27.57 2,291 27.57
30.57 – 38.74 2,906 4.5 33.01 2,906 33.01
38.75 – 42.85 2,571 5.5 39.88 2,534 39.85
43.07 – 47.25 3,120 7.3 44.73 1,493 44.41
47.32 – 67.67 2,861 8.7 55.59 571 48.95
$ 21.16 – $ 67.67 16,336 5.2 $ 37.95 12,382 $ 33.44
As of December 31, 2008, the aggregate intrinsic value of
stock options outstanding was $158 million, with a weighted-
average remaining term of 5.2 years. The aggregate intrinsic
value of stock options exercisable at that same date was $156
million, with a weighted-average remaining term of 4.1 years.
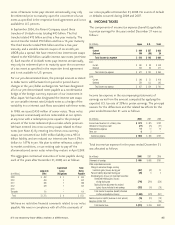
The following table summarizes stock option activity during
the years ended December 31.
(In millions) 2008 2007 2006
Total intrinsic value of options exercised $ 59 $ 154 $ 62
Cash received from options exercised 38 52 38
Tax benefit realized as a result of options exercised
and restricted stock releases 23 51 19
The value of restricted stock awards is based on the fair
market value of our common stock at the date of grant. The
following table summarizes restricted stock activity during the
years ended December 31.


