Aflac 2008 Annual Report Download - page 80
Download and view the complete annual report
Please find page 80 of the 2008 Aflac annual report below. You can navigate through the pages in the report by either clicking on the pages listed below, or by using the keyword search tool below to find specific information within the annual report.-
 1
1 -
2
-
3
-
4
-
5
-
6
-
7
-
8
-
9
-
10
-
11
-
12
-
13
-
14
-
15
-
16
-
17
-
18
-
19
-
20
-
21
-
22
-
23
-
24
-
25
-
26
-
27
-
28
-
29
-
30
-
31
-
32
-
33
-
34
-
35
-
36
-
37
-
38
-
39
-
40
-
41
-
42
-
43
-
44
-
45
-
46
-
47
-
48
-
49
-
50
-
51
-
52
-
53
-
54
-
55
-
56
-
57
-
58
-
59
-
60
-
61
-
62
-
63
-
64
-
65
-
66
-
67
-
68
-
69
-
 70
70 -
 71
71 -
 72
72 -
 73
73 -
 74
74 -
 75
75 -
 76
76 -
 77
77 -
 78
78 -
 79
79 -
 80
80 -
 81
81 -
 82
82 -
 83
83 -
 84
84 -
 85
85 -
 86
86 -
 87
87 -
 88
88 -
 89
89 -
 90
90 -
91
-
92
-
93
-
94
-
95
-
96
-
97
-
98
-
99
-
100
-
101
-
102
 |
 |

76 Aflac Incorporated Annual Report for 2008
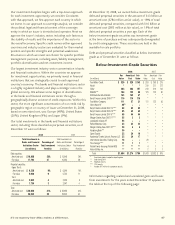
December 31, 2008, UPM was rated Baa3, BBB-, and BB+ by
Moody’s, S&P, and Fitch, respectively, and was classified by us
as an investment grade security. However, subsequent to year
end, UPM was downgraded to Ba1 by Moody‘s. As a result
of the downgrade by Moody‘s, we reclassified UPM to below
investment grade in the first quarter of 2009 in accordance
with our investment policy.
We have considered the factors impacting the fair value of
UPM as of December 31, 2008, and based on our credit
analysis, we believe that UPM’s ability to service its obligation
to Aflac is currently not impaired. Furthermore, the contractual
terms of this investment do not permit the issuer or its
parent to settle the security at a price less than the amortized
cost of the investment. Accordingly, we currently believe it
is probable that we will collect all amounts due according
to the contractual terms of the investment. Therefore, it is
expected that our investment would not be settled at a price
less than the amortized cost of the investment. Because we
have the intent and ability to hold this investment in UPM
until recovery of fair value, which may be the investments’
respective maturities, we do not consider these investments to
be other-than-temporarily impaired at December 31, 2008.
We have determined that the majority of the unrealized
losses on the investments in the other corporate sector were
caused by widening credit spreads globally and to a lesser
extent, changes in foreign exchange rates. Due to the liquidity
contraction experienced in the capital markets during 2008,
credit spreads continued to widen sharply throughout the year
causing the increase in the unrealized losses in this sector as of
December 31, 2008, compared with prior year. Also impacting
the unrealized losses in this sector is the decline in credit
worthiness of certain issuers in the other corporate sector.
However, consistent with our above discussions of certain
specific issuers within this sector, we have determined that the
ability of these issuers to service our investments has not been
impaired by these factors. Because we consider the decline
in the value of these securities to be temporary and because
we have the ability and intent to hold them until a recovery
of fair value, which may be maturity, we do not consider
these investments to be other than temporarily impaired at
December 31, 2008. Based on our credit related reviews of
the issuers in the other corporate sector, we have determined
that there is little risk that we will not recover our investment
in these issuers. Because we have the ability and intent to hold
these investments until a recovery of fair value, which may be
maturity, we do not consider these investments to be other-
than-temporarily impaired at December 31, 2008.
The majority of our investments in Upper Tier II and Tier
I perpetual securities were in highly-rated global financial
institutions. Upper Tier II securities have more debt-like
characteristics than Tier I securities and are senior to Tier
I securities, preferred stock, and common equity of the
issuer. Conversely, Tier I securities have more equity-like
characteristics, but are senior to the common equity of the
issuer. They may also be senior to preferred shares, depending
on the individual security, the issuer’s capital structure and the
regulatory jurisdiction of the issuer. Details of our holdings of
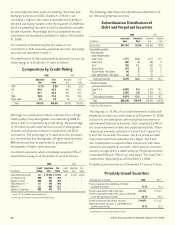
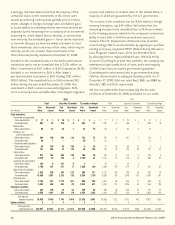
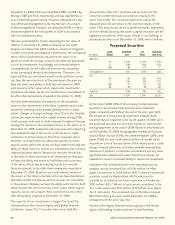
perpetual securities as of December 31, 2008, were as follows:
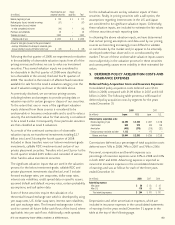
Perpetual Securities
Credit Amortized Fair Unrealized
(In millions) Rating Cost Value Gain (Loss)
Upper Tier II:
AA $ 3,534 $ 3,408 $ (126)
A 2,599 2,448 (151)
BBB 399 411 12
Total Upper Tier II 6,532 6,267 (265)
Tier I:
AA 937 683 (254)
A 1,302 891 (411)
BBB 170 118 (52)
BB 133 88 (45)
Total Tier I 2,542 1,780 (762)
Total $ 9,074 $ 8,047 $ (1,027)
At the end of 2008, 96% of the company’s total perpetual
securities in an unrealized loss position were investment
grade, compared with 93% at the end of the prior year. With
the exception of the previously mentioned Icelandic bank
securities that we impaired in the fourth quarter of 2008, all of
the perpetual securities we own were current on interest and
principal payments at the end of 2008. Based on amortized cost
as of December 31, 2008, the geographic breakdown by issuer
was as follows: Europe (65%); the United Kingdom (20%); and
Japan (12%). For any credit-related declines in market value,
we perform a more focused review of the related issuer’s credit
ratings, financial statements and other available financial data,
timeliness of payment, competitive environment and any other
significant data related to the issuer. From those reviews, we
evaluate the issuer’s continued ability to service our investment.
Included in the unrealized losses in the perpetual security
category was an unrealized loss of $106 million on Aflac
Japan’s investment of $393 million (¥35.7 billion) in perpetual
securities issued by Nordea Bank AB (Nordea) and its
subsidiaries. Included in our total investment in Nordea was
$283 million (¥25.7 billion) of instruments considered to be
Tier I instruments and $110 million (¥10 billion) in an Upper
Tier II instrument. The unrealized loss on Nordea increased
$82 million during the year ended December 31, 2008 as
compared with the prior year end.
Nordea is the largest financial services group in the Nordic
region with leading market positions in retail banking,