Aflac 2008 Annual Report Download - page 50
Download and view the complete annual report
Please find page 50 of the 2008 Aflac annual report below. You can navigate through the pages in the report by either clicking on the pages listed below, or by using the keyword search tool below to find specific information within the annual report.-
 1
1 -
2
-
3
-
4
-
5
-
6
-
7
-
8
-
9
-
10
-
11
-
12
-
13
-
14
-
15
-
16
-
17
-
18
-
19
-
20
-
21
-
22
-
23
-
24
-
25
-
26
-
27
-
28
-
29
-
30
-
31
-
32
-
33
-
34
-
35
-
36
-
37
-
38
-
39
-
 40
40 -
 41
41 -
 42
42 -
 43
43 -
 44
44 -
 45
45 -
 46
46 -
 47
47 -
 48
48 -
 49
49 -
 50
50 -
 51
51 -
 52
52 -
 53
53 -
 54
54 -
 55
55 -
 56
56 -
 57
57 -
 58
58 -
 59
59 -
 60
60 -
61
-
62
-
63
-
64
-
65
-
66
-
67
-
68
-
69
-
70
-
71
-
72
-
73
-
74
-
75
-
76
-
77
-
78
-
79
-
80
-
81
-
82
-
83
-
84
-
85
-
86
-
87
-
88
-
89
-
90
-
91
-
92
-
93
-
94
-
95
-
96
-
97
-
98
-
99
-
100
-
101
-
102
 |
 |

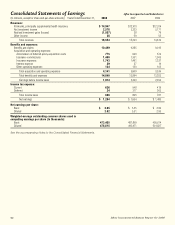
46 Aflac Incorporated Annual Report for 2008
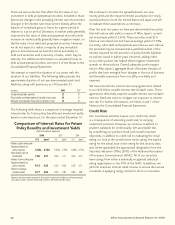
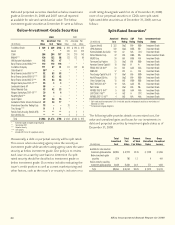
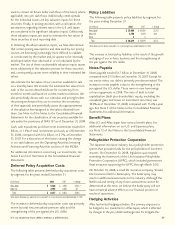
Gross realized pretax investment losses on debt and perpetual
securities, as a result of sales and impairment charges, were as
follows for the year ended December 31, 2008:
See Notes 1 and 3 of the Notes to the Consolidated Financial
Statements and the Realized Investment Gains and Losses
section of this MD&A for additional information.
Investment Valuation and Cash
SFAS 157 specifies a hierarchy of valuation techniques based
on whether the inputs to those valuation techniques are
observable or unobservable. These two types of inputs create
three valuation hierarchy levels. Level 1 valuations reflect
quoted market prices for identical assets or liabilities in active
markets. Level 2 valuations reflect quoted market prices for
similar assets or liabilities in an active market, quoted market
prices for identical or similar assets or liabilities in non-active
markets or model derived valuations in which all significant
valuation inputs are observable in active markets. Level 3
valuations reflect valuations in which one or more of the
significant valuation inputs are not observable in an active
market. The vast majority of our financial instruments subject
to the classification provisions of SFAS 157 relate to our
investment securities classified as securities available for sale in
our investment portfolio. We determine the fair value of our
securities available for sale using several sources or techniques
based on the type and nature of the investment securities.
For securities categorized as Level 1, we obtain quoted market
prices for identical securities traded in active markets that are
readily and regularly available to us.
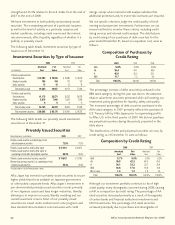
For securities categorized as Level 2, we determine the fair
value using three techniques, depending on the source and
availability of market inputs. Of these securities, approximately
36% are valued by obtaining quoted prices from our custodian.
The custodian obtains price quotes from various pricing
services who estimate their fair values based on observable
market transactions for similar investments in active markets,
market transactions for the same investments in inactive
markets or other observable market data where available.
The fair value of approximately 59% of our Level 2 securities is
determined using discounted cash flow (DCF) pricing models
that employ observable and corroborated market inputs from
both active and inactive markets. The estimated fair values
developed by the DCF pricing models are most sensitive to
prevailing credit spreads, the level of interest rates (yields)
and interest rate volatility. Credit spreads are derived based
on pricing data obtained from investment brokers and take
into account the current yield curve, time to maturity and
subordination levels for similar securities or classes of securities.
We validate the reliability of the DCF pricing models periodically
by using the models to price investments for which there are
quoted market prices from active markets or, in the alternative,
are quoted by our custodian. For the remaining Level 2
securities that are not quoted by our custodian and cannot be
priced under the DCF pricing model, we obtain specific broker
quotes from up to three brokers and use the average of the
three quotes to estimate the fair value of the securities.
The fair value of our securities classified as Level 3 is estimated
by obtaining broker quotes from a limited number of brokers.
These brokers base their quotes on a combination of their
knowledge of the current pricing environment and market
flows. We consider these inputs unobservable.
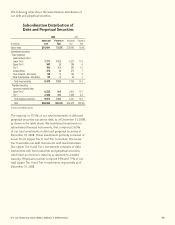
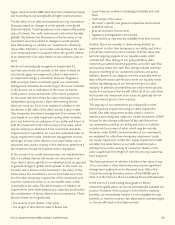
As a result of the continued contraction of observable
valuation inputs, we transferred investments totaling $2.7
billion into Level 3 during the fourth quarter of 2008.
Included in these transfers were our below-investment-grade
investments, callable reverse-dual currency (RDC) investments
and certain of our private placement securities. Transfers into
Level 3 prior to the fourth quarter totaled $245 million and
consisted of various other hard-to-value investment securities.
The significant valuation inputs that are used in the valuation
process for the below-investment-grade, callable RDC and
private placement investments classified as Level 3 include
forward exchange rates, yen swap rates, dollar swap rates,
interest rate volatilities, credit spread data on specific issuers,
assumed default and default recovery rates, certain probability
assumptions, and call option data.
Some of these securities require the calculation of a
theoretical forward exchange rate which is developed by using
yen swap rates, U.S. dollar swap rates, interest rate volatilities,
and spot exchange rates. The forward exchange rate is then
Gross Realized Losses on
Debt and Perpetual Securities
Sales Total Realized
(In millions)
Proceeds Losses Impairments Losses
Investment-grade securities,
length of consecutive unrealized loss:
Less than six months $ 258 $ 50 $ – $ 50
Six months to 12 months 67 38 15 53
Over 12 months 79 186 358 544
Below-investment-grade securities,
length of consecutive unrealized loss:
Less than six months 90 1 29 30
Six months to 12 months – – 40 40
Over 12 months 1 – 310 310
Total $ 495 $ 275 $ 752 $ 1,027
(In millions) 2008 2007 2006
Debt securities $ 373 $ 22 $ –
Perpetual securities 379 – –
Equity securities 1 1 1
Total $ 753 $ 23 $ 1