Aflac 2008 Annual Report Download - page 58
Download and view the complete annual report
Please find page 58 of the 2008 Aflac annual report below. You can navigate through the pages in the report by either clicking on the pages listed below, or by using the keyword search tool below to find specific information within the annual report.-
 1
1 -
2
-
3
-
4
-
5
-
6
-
7
-
8
-
9
-
10
-
11
-
12
-
13
-
14
-
15
-
16
-
17
-
18
-
19
-
20
-
21
-
22
-
23
-
24
-
25
-
26
-
27
-
28
-
29
-
30
-
31
-
32
-
33
-
34
-
35
-
36
-
37
-
38
-
39
-
40
-
41
-
42
-
43
-
44
-
45
-
46
-
47
-
 48
48 -
 49
49 -
 50
50 -
 51
51 -
 52
52 -
 53
53 -
 54
54 -
 55
55 -
 56
56 -
 57
57 -
 58
58 -
 59
59 -
 60
60 -
 61
61 -
 62
62 -
 63
63 -
 64
64 -
 65
65 -
 66
66 -
 67
67 -
 68
68 -
69
-
70
-
71
-
72
-
73
-
74
-
75
-
76
-
77
-
78
-
79
-
80
-
81
-
82
-
83
-
84
-
85
-
86
-
87
-
88
-
89
-
90
-
91
-
92
-
93
-
94
-
95
-
96
-
97
-
98
-
99
-
100
-
101
-
102
 |
 |

54 Aflac Incorporated Annual Report for 2008
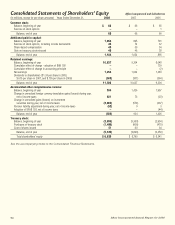
Consolidated Statements of Shareholders’ Equity Aflac Incorporated and Subsidiaries
(In millions, except for per-share amounts) Years Ended December 31, 2008 2007 2006
Common stock:
Balance, beginning of year $ 66 $ 66 $ 65
Exercise of stock options – – 1
Balance, end of year 66 66 66
Additional paid-in capital:
Balance, beginning of year 1,054 895 791
Exercise of stock options, including income tax benefits 44 74 32
Share-based compensation 40 39 34
Gain on treasury stock reissued 46 46 38
Balance, end of year 1,184 1,054 895
Retained earnings:
Balance, beginning of year 10,637 9,304 8,048
Cumulative effect of change - adoption of SAB 108 – – 139
Cumulative effect of change in accounting principle – – (2)
Net earnings 1,254 1,634 1,483
Dividends to shareholders ($1.24 per share in 2008,
$.615 per share in 2007, and $.735 per share in 2006) (585) (301) (364)
Balance, end of year 11,306 10,637 9,304
Accumulated other comprehensive income:
Balance, beginning of year 934 1,426 1,957
Change in unrealized foreign currency translation gains (losses) during year,
net of income taxes 621 75 (23)
Change in unrealized gains (losses) on investment
securities during year, net of income taxes (2,085) (576) (467)
Pension liability adjustment during year, net of income taxes (52) 9 3
Adoption of SFAS 158, net of income taxes – – (44)
Balance, end of year (582) 934 1,426
Treasury stock:
Balance, beginning of year (3,896) (3,350) (2,934)
Purchases of treasury stock (1,490) (606) (470)
Cost of shares issued 51 60 54
Balance, end of year (5,335) (3,896) (3,350)
Total shareholders’ equity $ 6,639 $ 8,795 $ 8,341
See the accompanying Notes to the Consolidated Financial Statements.