Aflac 2008 Annual Report Download - page 49
Download and view the complete annual report
Please find page 49 of the 2008 Aflac annual report below. You can navigate through the pages in the report by either clicking on the pages listed below, or by using the keyword search tool below to find specific information within the annual report.-
 1
1 -
2
-
3
-
4
-
5
-
6
-
7
-
8
-
9
-
10
-
11
-
12
-
13
-
14
-
15
-
16
-
17
-
18
-
19
-
20
-
21
-
22
-
23
-
24
-
25
-
26
-
27
-
28
-
29
-
30
-
31
-
32
-
33
-
34
-
35
-
36
-
37
-
38
-
 39
39 -
 40
40 -
 41
41 -
 42
42 -
 43
43 -
 44
44 -
 45
45 -
 46
46 -
 47
47 -
 48
48 -
 49
49 -
 50
50 -
 51
51 -
 52
52 -
 53
53 -
 54
54 -
 55
55 -
 56
56 -
 57
57 -
 58
58 -
 59
59 -
60
-
61
-
62
-
63
-
64
-
65
-
66
-
67
-
68
-
69
-
70
-
71
-
72
-
73
-
74
-
75
-
76
-
77
-
78
-
79
-
80
-
81
-
82
-
83
-
84
-
85
-
86
-
87
-
88
-
89
-
90
-
91
-
92
-
93
-
94
-
95
-
96
-
97
-
98
-
99
-
100
-
101
-
102
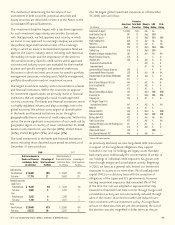
 |
 |

45
It’s no mystery how Aflac makes a difference.
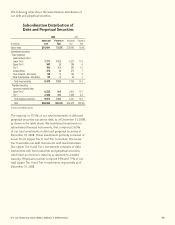
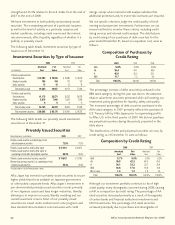
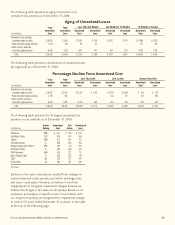
The following table presents an aging of securities in an
unrealized loss position as of December 31, 2008.
The following table presents a distribution of unrealized losses
by magnitude as of December 31, 2008.
The following table presents the 10 largest unrealized loss
positions in our portfolio as of December 31, 2008.
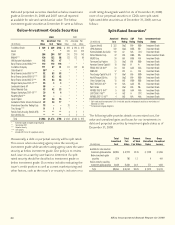
Declines in fair value noted above resulted from changes in
interest rates and credit spreads, yen/dollar exchange rates,
and issuer credit status. However, we believe it would be
inappropriate to recognize impairment charges because we
believe the changes in fair value are temporary. Based on our
evaluation and analysis of specific issuers in accordance with
our impairment policy, we recognized the impairment charges
in each of the years ended December 31 as shown in the table
at the top of the following page:
Aging of Unrealized Losses
Total Total Less Than Six Months Six Months to 12 Months 12 Months or Greater
Amortized Unrealized Amortized Unrealized Amortized Unrealized Amortized Unrealized
(In millions) Cost Loss Cost Loss Cost Loss Cost Loss
Available-for-sale securities:
Investment-grade securities $ 20,620 $ 3,599 $ 3,554 $ 356 $ 2,977 $ 618 $ 14,089 $ 2,625
Below-investment-grade securities 1,016 494 99 45 – – 917 449
Held-to-maturity securities:
Investment-grade securities 14,009 1,923 1,551 157 934 233 11,524 1,533
Total $ 35,645 $ 6,016 $ 5,204 $ 558 $ 3,911 $ 851 $ 26,530 $ 4,607
Percentage Decline From Amortized Cost
Total Total Less Than 20% 20% to 50% Greater Than 50%
Amortized Unrealized Amortized Unrealized Amortized Unrealized Amortized Unrealized
(In millions) Cost Loss Cost Loss Cost Loss Cost Loss
Available-for-sale securities:
Investment-grade securities $ 20,620 $ 3,599 $ 13,197 $ 1,150 $ 6,729 $ 2,029 $ 694 $ 420
Below-investment-grade securities 1,016 494 – – 543 211 473 283
Held-to-maturity securities:
Investment-grade securities 14,009 1,923 12,133 966 951 290 925 667
Total $ 35,645 $ 6,016 $ 25,330 $ 2,116 $ 8,223 $ 2,530 $ 2,092 $ 1,370
Credit Amortized Fair Unrealized
(In millions) Rating Cost Value Loss
SLM Corp. BBB $ 361 $ 125 $ 236
Ford Motor Credit CCC 329 143 186
Takefuji BBB 617 444 173
Unicredito Italiano A 558 405 153
Morgan Stanley Aces 2008-6* BBB 200 50 150
Sultanate of Oman A 384 260 124
UPM-Kymmene BBB 339 222 117
Banco Espirito Santo A 330 220 110
CSAV BB 264 157 107
Nordea Bank AA 393 287 106
* CDO Security