Aflac 2008 Annual Report Download - page 85
Download and view the complete annual report
Please find page 85 of the 2008 Aflac annual report below. You can navigate through the pages in the report by either clicking on the pages listed below, or by using the keyword search tool below to find specific information within the annual report.-
 1
1 -
2
-
3
-
4
-
5
-
6
-
7
-
8
-
9
-
10
-
11
-
12
-
13
-
14
-
15
-
16
-
17
-
18
-
19
-
20
-
21
-
22
-
23
-
24
-
25
-
26
-
27
-
28
-
29
-
30
-
31
-
32
-
33
-
34
-
35
-
36
-
37
-
38
-
39
-
40
-
41
-
42
-
43
-
44
-
45
-
46
-
47
-
48
-
49
-
50
-
51
-
52
-
53
-
54
-
55
-
56
-
57
-
58
-
59
-
60
-
61
-
62
-
63
-
64
-
65
-
66
-
67
-
68
-
69
-
70
-
71
-
72
-
73
-
74
-
 75
75 -
 76
76 -
 77
77 -
 78
78 -
 79
79 -
 80
80 -
 81
81 -
 82
82 -
 83
83 -
 84
84 -
 85
85 -
 86
86 -
 87
87 -
 88
88 -
 89
89 -
 90
90 -
 91
91 -
 92
92 -
 93
93 -
 94
94 -
 95
95 -
96
-
97
-
98
-
99
-
100
-
101
-
102
 |
 |

81
It’s no mystery how Aflac makes a difference.
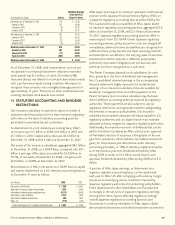
We determine the fair values of our debt, perpetual and
privately issued equity securities using three basic pricing
approaches or techniques: quoted market prices readily
available from public exchange markets, a discounted cash
flow (DCF) pricing model, and price quotes we obtain from
outside brokers.
Our DCF pricing model utilizes various market inputs we
obtain from both active and inactive markets. The estimated
fair values developed by the DCF pricing models are most
sensitive to prevailing credit spreads, the level of interest rates
(yields) and interest rate volatility. Credit spreads are derived
based on pricing data obtained from investment brokers and
take into account the current yield curve, time to maturity
and subordination levels for similar securities or classes of
securities. We validate the reliability of the DCF pricing models
periodically by using the models to price investments for
which there are quoted market prices from active and inactive
markets or, in the alternative, are quoted by our custodian for
the same or similar securities.
The pricing data and market quotes we obtain from outside
sources are reviewed internally for reasonableness. If a fair
value appears unreasonable, the inputs are re-examined and
the value is confirmed or revised.
During 2008, we have noted a continued reduction in the
availability of pricing data from market sources. This decline is
due largely to the contraction of liquidity in the global markets
and a reduction in the overall number of sources to provide
pricing data. As a result, we have noted that available pricing
data has become more volatile. The reduction in available
pricing sources coupled with the increase in price volatility has
increased the degree of management judgment required in
the final determination of fair values. We continually assess the
reasonableness of the pricing data we receive by comparing
it to historical results. In addition to historical comparisons,
we evaluate the reasonableness of the pricing data in light of
current market trends and events. The final pricing data used
to determine fair values is based on management’s judgment.
The fair values of notes payable with fixed interest rates were
obtained from an independent financial information service.
The fair values of our cross-currency and interest-rate swaps
are the expected amounts that we would receive or pay to
terminate the swaps, taking into account current interest rates,
foreign currency rates and the current creditworthiness of the
swap counterparties. The fair value of the obligation to the
Japanese policyholder protection corporation is our estimated
share of the industry’s obligation calculated on a pro rata basis
by projecting our percentage of the industry’s premiums and
reserves and applying that percentage to the total industry
obligation payable in future years.
The carrying amounts for cash and cash equivalents,
receivables, accrued investment income, accounts payable, cash
collateral and payables for security transactions approximated
their fair values due to the short-term nature of these
instruments. Consequently, such instruments are not included
in the above table. The preceding table also excludes liabilities
for future policy benefits and unpaid policy claims as these
liabilities are not financial instruments as defined by GAAP.
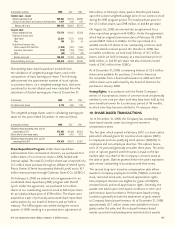
We have outstanding cross-currency swap agreements related
to the $450 million senior notes (see Note 7). We have
designated the foreign currency component of these cross-
currency swaps as a hedge of the foreign currency exposure
of our investment in Aflac Japan. The notional amounts
and terms of the swaps match the principal amount and
terms of the senior notes. We entered into cross-currency
swaps to minimize the impact of foreign currency translation
on shareholders’ equity and to reduce interest expense by
converting the dollar-denominated principal and interest on
the senior notes we issued into yen-denominated obligations.
By entering into these cross-currency swaps, we converted
our $450 million liability into a ¥55.6 billion liability, and we
reduced our interest rate from 6.5% in dollars to 1.67% in yen.
See Note 1 for information on the accounting policy for cross-
currency swaps.
We have interest-rate swap agreements related to the ¥20
billion variable interest rate Uridashi notes (see Note 7). By
entering into these contracts, we have been able to lock in
the interest rate at 1.52% in yen. We have designated these
interest rate swaps as a hedge of the variability in our interest
cash flows associated with the variable interest rate Uridashi
notes. The notional amounts and terms of the swaps match
the principal amount and terms of the variable interest rate
Uridashi notes. The swaps had no value at inception. Changes
in the fair value of the swap contracts are recorded in other
comprehensive income.
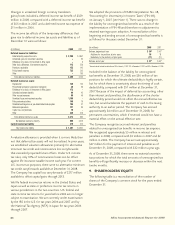
The components of the fair value of the cross-currency and
interest-rate swaps were reflected as an asset or (liability) in
the balance sheet as of December 31 as follows:
(In millions) 2008 2007
Interest rate component $ 2 $ 7
Foreign currency component (164) (47)
Accrued interest component 4 5
Total fair value of cross-currency swaps and interest-rate swaps $ (158) $ (35)
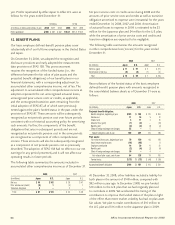
The table at the top of the following page is a reconciliation of
the foreign currency component of the cross-currency swaps
included in accumulated other comprehensive income for the
years ended December 31.