Aflac 2008 Annual Report Download - page 74
Download and view the complete annual report
Please find page 74 of the 2008 Aflac annual report below. You can navigate through the pages in the report by either clicking on the pages listed below, or by using the keyword search tool below to find specific information within the annual report.-
 1
1 -
2
-
3
-
4
-
5
-
6
-
7
-
8
-
9
-
10
-
11
-
12
-
13
-
14
-
15
-
16
-
17
-
18
-
19
-
20
-
21
-
22
-
23
-
24
-
25
-
26
-
27
-
28
-
29
-
30
-
31
-
32
-
33
-
34
-
35
-
36
-
37
-
38
-
39
-
40
-
41
-
42
-
43
-
44
-
45
-
46
-
47
-
48
-
49
-
50
-
51
-
52
-
53
-
54
-
55
-
56
-
57
-
58
-
59
-
60
-
61
-
62
-
63
-
 64
64 -
 65
65 -
 66
66 -
 67
67 -
 68
68 -
 69
69 -
 70
70 -
 71
71 -
 72
72 -
 73
73 -
 74
74 -
 75
75 -
 76
76 -
 77
77 -
 78
78 -
 79
79 -
 80
80 -
 81
81 -
 82
82 -
 83
83 -
 84
84 -
85
-
86
-
87
-
88
-
89
-
90
-
91
-
92
-
93
-
94
-
95
-
96
-
97
-
98
-
99
-
100
-
101
-
102
 |
 |

70 Aflac Incorporated Annual Report for 2008
a year ago. We have determined that the majority of the
unrealized losses on the investments in this sector were
caused by widening credit spreads globally and, to a lesser
extent, changes in foreign exchange rates. Unrealized gains
or losses related to prevailing interest rate environments are
impacted by the remaining time to maturity of an investment.
Assuming no credit-related factors develop, as investments
near maturity, the unrealized gains or losses can be expected
to diminish. Because we have the ability and intent to hold
these investments until a recovery of fair value, which may be
maturity, we do not consider these investments to be
other-than-temporarily impaired at December 31, 2008.
Included in the unrealized losses on the banks and financial
institutions sector was an unrealized loss of $236 million on
Aflac’s investment of $361 million in SLM Corporation (SLM).
Included in our investment in SLM is Aflac Japan’s
yen-denominated investment in SLM totaling $331 million
(¥30.1 billion). The unrealized loss on SLM increased $92
million during the year ended December 31, 2008. Our
investment in SLM is senior unsecured obligations. SLM,
more commonly known as Sallie Mae, is the largest originator,
servicer, and collector of student loans in the United States, a
majority of which are guaranteed by the U.S. government.
The increase in the unrealized loss for SLM related to foreign
currency translation was $45 million. We believe that the
remaining increase in the unrealized loss on SLM was related
to the funding pressures related to the company’s constrained
ability to raise debt in both the secured and unsecured
markets. The U.S. Department of Education has provided
some funding relief to student lenders by agreeing to purchase
existing and newly originated FFELP (Federal Family Education
Loan Program) student loans, which has benefited SLM
by allowing them to make profitable loans. While SLM has
focused on building its private loan portfolio, the company has
maintained a high quality book of loans, and a vast majority
of SLM’s loans carry an explicit government guarantee.
Considering this environment and its government backing,
SLM has demonstrated an adequate liquidity profile. As of
December 31, 2008, SLM was rated Baa2, BBB-, and BBB by
Moody’s, S&P, and Fitch, respectively.
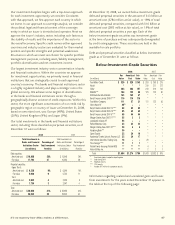
We have considered the factors impacting the fair value
of SLM as of December 31, 2008, and based on our credit
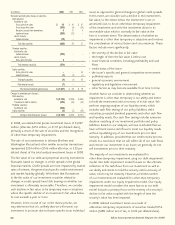
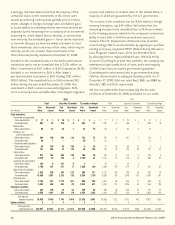
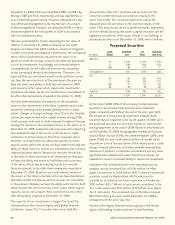
2008 2007
Total Less than 12 months 12 months or longer Total Less than 12 months 12 months or longer
Fair Unrealized Fair Unrealized Fair Unrealized Fair Unrealized Fair Unrealized Fair Unrealized
(In millions) Value Losses Value Losses Value Losses Value Losses Value Losses Value Losses
Fixed maturities:
Government and guaranteed:
Dollar-denominated $ 77 $ 1 $ 76 $ 1 $ 1 $ – $ 77 $ 1 $ 20 $ – $ 57 $ 1
Yen-denominated 803 16 309 5 494 11 1,752 37 458 2 1,294 35
Municipalities:
Dollar-denominated 69 14 28 1 41 13 62 5 50 5 12 –
Mortgage- and
asset-backed securities:
Dollar-denominated 406 189 284 138 122 51 297 14 181 7 116 7
Yen-denominated 26 1 – – 26 1 30 – – – 30 –
Collateralized debt obligations:
Dollar-denominated 60 188 56 162 4 26 76 16 68 14 8 2
Yen-denominated 101 295 75 145 26 150 324 79 214 49 110 30
Public utilities:
Dollar-denominated 812 165 566 106 246 59 283 13 115 4 168 9
Yen-denominated 2,376 83 184 2 2,192 81 1,314 97 379 15 935 82
Sovereign and supranational:
Dollar-denominated 106 9 101 9 5 – 28 2 28 2 – –
Yen-denominated 1,780 257 571 71 1,209 186 1,884 100 974 17 910 83
Banks/financial institutions:
Dollar-denominated 1,528 529 830 212 698 317 1,220 106 796 68 424 38
Yen-denominated 10,458 1,881 2,128 152 8,330 1,729 8,588 756 3,408 155 5,180 601
Other corporate:
Dollar-denominated 2,166 501 1,178 241 988 260 1,402 88 819 27 583 61
Yen-denominated 4,342 660 420 29 3,922 631 3,294 313 1,528 67 1,766 246
Perpetual securities:
Dollar-denominated 235 136 70 46 165 90 295 38 125 16 170 22
Yen-denominated 4,284 1,091 830 89 3,454 1,002 3,463 457 609 39 2,854 418
Total debt and
perpetual securities 29,629 6,016 7,706 1,409 21,923 4,607 24,389 2,122 9,772 487 14,617 1,635
Equity securities 8 2 5 1 3 1 5 1 4 1 1 –
Total temporarily
impaired securities $ 29,637 $ 6,018 $ 7,711 $ 1,410 $ 21,926 $ 4,608 $ 24,394 $ 2,123 $ 9,776 $ 488 $ 14,618 $ 1,635