Aflac 2008 Annual Report Download - page 72
Download and view the complete annual report
Please find page 72 of the 2008 Aflac annual report below. You can navigate through the pages in the report by either clicking on the pages listed below, or by using the keyword search tool below to find specific information within the annual report.-
 1
1 -
2
-
3
-
4
-
5
-
6
-
7
-
8
-
9
-
10
-
11
-
12
-
13
-
14
-
15
-
16
-
17
-
18
-
19
-
20
-
21
-
22
-
23
-
24
-
25
-
26
-
27
-
28
-
29
-
30
-
31
-
32
-
33
-
34
-
35
-
36
-
37
-
38
-
39
-
40
-
41
-
42
-
43
-
44
-
45
-
46
-
47
-
48
-
49
-
50
-
51
-
52
-
53
-
54
-
55
-
56
-
57
-
58
-
59
-
60
-
61
-
 62
62 -
 63
63 -
 64
64 -
 65
65 -
 66
66 -
 67
67 -
 68
68 -
 69
69 -
 70
70 -
 71
71 -
 72
72 -
 73
73 -
 74
74 -
 75
75 -
 76
76 -
 77
77 -
 78
78 -
 79
79 -
 80
80 -
 81
81 -
 82
82 -
83
-
84
-
85
-
86
-
87
-
88
-
89
-
90
-
91
-
92
-
93
-
94
-
95
-
96
-
97
-
98
-
99
-
100
-
101
-
102
 |
 |

68 Aflac Incorporated Annual Report for 2008
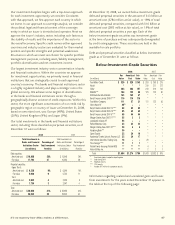
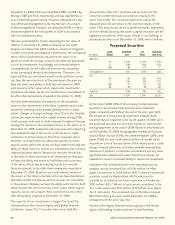
(In millions) 2008 2007 2006
Realized investment gains (losses) on securities:
Debt securities:
Available for sale:
Gross gains from sales $ 10 $ 40 $ 67
Gross losses from sales (265) (6) (34)
Net gains (losses) from redemptions 3 17 4
Impairment losses (298) (22) –
Held to maturity:
Impairment losses (75) – –
Total debt securities (625) 29 37
Perpetual securities:
Available for sale:
Impairment losses (379) – –
Held to maturity:
Gross gains from sales 5 – –
Total perpetual securities (374) – –
Equity securities:
Gross gains from sales – – 43
Impairment losses (1) (1) (1)
Total equity securities (1) (1) 42
Other long-term assets (7) – –
Total realized investment gains (losses) $ (1,007) $ 28 $ 79
Changes in unrealized gains (losses):
Debt securities:
Available for sale $ (2,134) $ (838) $ (624)
Transferred to held to maturity (165) (35) (52)
Perpetual securities:
Available for sale (850) – –
Equity securities (3) (3) (45)
Change in unrealized gains (losses) $ (3,152) $ (876) $ (721)
In 2008, we realized total pretax investment losses of $1,007
million (after-tax, $655 million, or $1.37 per diluted share),
primarily a result of the sale of securities and the recognition
of other-than-temporary impairments.
The sale of our investments in Lehman Brothers and
Washington Mutual and other smaller securities transactions
represented $254 million ($166 million after-tax, or $.35 per
diluted share) of the total realized investment losses in 2008.
The fair value of our debt and perpetual security investments
fluctuates based on changes in credit spreads in the global
financial markets. Credit spreads are most impacted by market
rates of interest, the general and specific credit environment
and market liquidity globally. We believe that fluctuations
in the fair value of our investment securities related to
changes in credit spreads have little bearing on whether our
investment is ultimately recoverable. Therefore, we consider
such declines in fair value to be temporary even in situations
where the specific decline of an investment’s fair value below
its cost exceeds a year or more.
However, in the course of our credit review process, we
may determine that it is unlikely that we will recover our
investment in an issuer due to factors specific to an individual
issuer, as opposed to general changes in global credit spreads.
In this event, we consider such a decline in the investment’s
fair value, to the extent below the investment’s cost or
amortized cost, to be an other-than-temporary impairment
of the investment and write the investment down to its
recoverable value which is normally its fair value at the
time it is written down. The determination of whether an
impairment is other than temporary is subjective and involves
the consideration of various factors and circumstances. These
factors include more significantly:
• the severity of the decline in fair value
• the length of time the fair value is below cost
• issuer financial condition, including profitability and cash
flows
• credit status of the issuer
• the issuer’s specific and general competitive environment
• published reports
• general economic environment
• regulatory and legislative environment
• other factors as may become available from time to time
Another factor we consider in determining whether an
impairment is other than temporary is our ability and intent
to hold the investment until a recovery of its fair value. We
perform ongoing analyses of our liquidity needs, which
includes cash flow testing of our policy liabilities, debt
maturities, projected dividend payments and other cash flow
and liquidity needs. Our cash flow testing includes extensive
duration matching of our investment portfolio and policy
liabilities. Based on our analyses, we have concluded that we
have sufficient excess cash flows to meet our liquidity needs
without liquidating any of our investments prior to their
maturity. In addition, provided that our credit review process
results in a conclusion that we will collect all of our cash flows
and recover our investment in an issuer, we generally do not
sell investments prior to their maturity.
The majority of our investments are evaluated for
other-than-temporary impairment using our debt impairment
model. Our debt impairment model focuses on the ultimate
collection of the cash flows from our investment as well as
our ability and intent to hold the security until a recovery of
value, which may be maturity. However, a limited number
of our investments are evaluated for other-than-temporary
impairment under our equity impairment model. Our equity
impairment model considers the same factors as our debt
model but puts a primary focus on the severity of a security’s
decline in fair value coupled with the length of time the
security’s value has been impaired.
In 2008, realized investment losses as a result of
other-than-temporary impairments of securities totaled $753
million ($489 million net of tax, or $1.02 per diluted share).