Aflac 2008 Annual Report Download - page 53
Download and view the complete annual report
Please find page 53 of the 2008 Aflac annual report below. You can navigate through the pages in the report by either clicking on the pages listed below, or by using the keyword search tool below to find specific information within the annual report.-
 1
1 -
2
-
3
-
4
-
5
-
6
-
7
-
8
-
9
-
10
-
11
-
12
-
13
-
14
-
15
-
16
-
17
-
18
-
19
-
20
-
21
-
22
-
23
-
24
-
25
-
26
-
27
-
28
-
29
-
30
-
31
-
32
-
33
-
34
-
35
-
36
-
37
-
38
-
39
-
40
-
41
-
42
-
 43
43 -
 44
44 -
 45
45 -
 46
46 -
 47
47 -
 48
48 -
 49
49 -
 50
50 -
 51
51 -
 52
52 -
 53
53 -
 54
54 -
 55
55 -
 56
56 -
 57
57 -
 58
58 -
 59
59 -
 60
60 -
 61
61 -
 62
62 -
 63
63 -
64
-
65
-
66
-
67
-
68
-
69
-
70
-
71
-
72
-
73
-
74
-
75
-
76
-
77
-
78
-
79
-
80
-
81
-
82
-
83
-
84
-
85
-
86
-
87
-
88
-
89
-
90
-
91
-
92
-
93
-
94
-
95
-
96
-
97
-
98
-
99
-
100
-
101
-
102
 |
 |

49
It’s no mystery how Aflac makes a difference.
assumptions for future policy persistency, mortality and
morbidity. The distribution of payments for unpaid policy
claims includes assumptions as to the timing of policyholders
reporting claims for prior periods and the amount of those
claims. Actual amounts and timing of both future policy
benefits and unpaid policy claims payments may differ
significantly from the estimates above. We anticipate that
the future policy benefit liability of $59.3 billion at December
31, 2008, along with future net premiums and investment
income, will be sufficient to fund future policy benefit
payments.
The distribution of payments due in less than one year for
long-term debt consists of $450 million for our senior notes
that are due in April 2009. We plan to either refinance,
subject to market conditions, or use existing cash to pay off
the aforementioned senior notes. The cross-currency interest-
rate swaps related to our senior notes will expire in April 2009
and as of December 31, 2008, would have required a payment
of $155 million to the swap counterparties. See Notes 4 and
7 of the Notes to the Consolidated Financial Statements for
more information.
Consolidated Cash Flows
We translate cash flows for Aflac Japan’s yen-denominated
items into U.S. dollars using weighted-average exchange
rates. In years when the yen weakens, translating yen into
dollars causes fewer dollars to be reported. When the yen
strengthens, translating yen into dollars causes more dollars
to be reported. The following table summarizes consolidated
cash flows by activity for the years ended December 31.
Operating Activities
The following table summarizes operating cash flows by
source for the years ended December 31.
The increase in Aflac Japan operating cash flows during 2008
was due primarily to the strengthening of the yen against the
U.S. dollar. The decrease in Aflac U.S. operating cash flows was
due primarily to increased U.S. federal tax payments. Cash tax
payments increased in 2008 because we have fully utilized
our remaining tax credit carryforwards. Cash provided by
operating activities was also reduced by the payout of lump-
sum return-of-premium benefits to policyholders on a closed
block of U.S. cancer insurance business. The majority of these
benefit payouts began in 2008 and will conclude in 2012. We
paid out $63 million in 2008, and we anticipate paying out an
additional $360 million over the next four years.
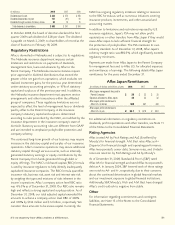
Investing Activities
Operating cash flow is primarily used to purchase debt
securities to meet future policy obligations. The following
table summarizes investing cash flows by source for the years
ended December 31.
The increase in Aflac Japan cash used by investing activities
during 2008 was due primarily to the strengthening of the yen
against the U.S. dollar.
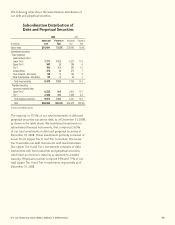
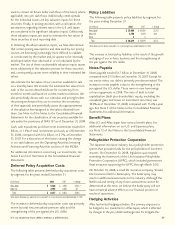
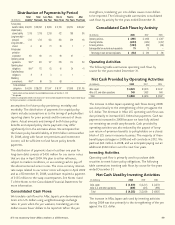
Distribution of Payments by Period
Total Total Less Than One to Four to After
(In millions) *Liability* Payments One Year Three Years Five Years Five Years
Future policy
benefits liability $ 59,310 $ 283,242 $ 8,808 $ 17,103 $ 16,724 $ 240,607
Unpaid policy
claims liability 3,118 3,118 2,318 422 188 190
Long-term debt –
principal 1,713 1,713 450 824 329 110
Long-term debt –
interest 6 64 21 29 7 7
Policyholder
protection
corporation 161 161 31 69 61 –
Operating service
agreements N/A** 674 127 223 174 150
Operating lease
obligations N/A** 173 63 45 24 41
Capitalized lease
obligations 8 8 3 4 1 –
Marketing
commitments N/A** 84 26 58 – –
Total contractual
obligations $ 64,316 $ 289,237 $ 11,847 $ 18,777 $ 17,508 $ 241,105
* Liability amounts are those reported on the consolidated balance sheet as of December 31, 2008.
** Not applicable
Liabilities for unrecognized tax benefits in the amount of $37 million have been excluded from the tabular disclosure above because
the timing of cash payment is not reasonably estimable.
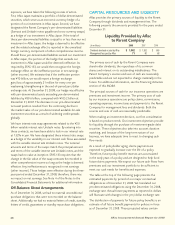
Consolidated Cash Flows by Activity
(In millions) 2008 2007
2006
Operating activities $ 4,965 $ 4,656 $ 4,397
Investing activities (4,283) (3,654) (4,057)
Financing activities (1,383) (655) (434)
Exchange effect on cash and cash equivalents 79 13 –
Net change in cash and cash equivalents $ (622) $ 360 $ (94)
Net Cash Provided by Operating Activities
(In millions)
2008 2007
2006
Aflac Japan $ 4,225 $ 3,573 $ 3,437
Aflac U.S. and other operations 740 1,083 960
Total $ 4,965 $ 4,656 $ 4,397
Net Cash Used by Investing Activities
(In millions)
2008 2007
2006
Aflac Japan $ (3,874) $ (3,231) $ (3,372)
Aflac U.S. and other operations (409) (423) (685)
Total $ (4,283) $ (3,654) $ (4,057)