Aflac 2008 Annual Report Download - page 13
Download and view the complete annual report
Please find page 13 of the 2008 Aflac annual report below. You can navigate through the pages in the report by either clicking on the pages listed below, or by using the keyword search tool below to find specific information within the annual report.-
 1
1 -
2
-
 3
3 -
 4
4 -
 5
5 -
 6
6 -
 7
7 -
 8
8 -
 9
9 -
 10
10 -
 11
11 -
 12
12 -
 13
13 -
 14
14 -
 15
15 -
 16
16 -
 17
17 -
 18
18 -
 19
19 -
 20
20 -
 21
21 -
 22
22 -
 23
23 -
24
-
25
-
26
-
27
-
28
-
29
-
30
-
31
-
32
-
33
-
34
-
35
-
36
-
37
-
38
-
39
-
40
-
41
-
42
-
43
-
44
-
45
-
46
-
47
-
48
-
49
-
50
-
51
-
52
-
53
-
54
-
55
-
56
-
57
-
58
-
59
-
60
-
61
-
62
-
63
-
64
-
65
-
66
-
67
-
68
-
69
-
70
-
71
-
72
-
73
-
74
-
75
-
76
-
77
-
78
-
79
-
80
-
81
-
82
-
83
-
84
-
85
-
86
-
87
-
88
-
89
-
90
-
91
-
92
-
93
-
94
-
95
-
96
-
97
-
98
-
99
-
100
-
101
-
102
 |
 |

9
It’s no mystery how Aflac makes a difference.
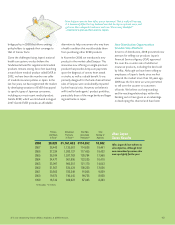
average exchange rate. We translate Aflac
Japan’s balance sheet using the end-of-
period exchange rate. Since Aflac Japan is
responsible for the majority of the amounts
reported in our consolidated financial
statements, fluctuations in the value of the
yen can significantly affect our results as
reported in dollars.
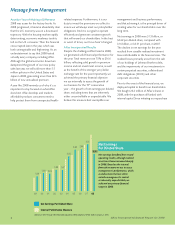
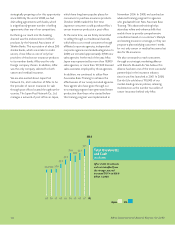
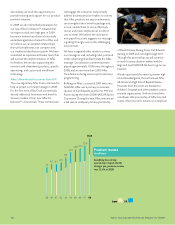
Translating Aflac Japan’s results from yen
into dollars means that growth rates are
magnified in dollar terms when the yen
strengthens against the dollar, compared with
the preceding year. Conversely, growth rates
in dollar terms are suppressed when the yen
weakens against the dollar, compared with
the preceding year. In 2008, the yen averaged
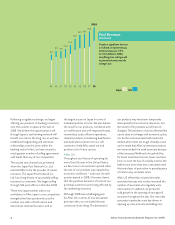
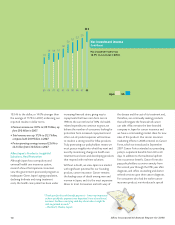
Yen/Dollar Exchange Rate (Closing rates)
The average yen/dollar exchange rate strengthened 14.0% in 2008,
which magnified Aflac Japan’s growth rates in dollar terms.
99 00 01 02 03 04 05 06 07 08
100
110
90
120
130
¥140